Key takeaways
- QUERY_HISTORY and INFORMATION_SCHEMA give you 60% of a cost tool for free; the workflow on top is what's expensive.
- BigQuery and Snowflake have fundamentally different billing models that don't share a schema cleanly.
- Maintenance cost on a DIY tool grows roughly with the number of platforms supported, not linearly with users.
- Anomaly detection and proactive alerting are where most DIY tools stop short, and where most cost spikes actually originate.
- Engineering time spent on internal cost tooling often costs more than the tool would have saved.
The story always starts the same way. Someone in finance flags that Snowflake spend is up 60% quarter-over-quarter. The CFO wants to know why, when, and what we're going to do about it. The engineering team then spends many months building a simple custom cost dashboard that pulled QUERY_HISTORY, joined to WAREHOUSE_METERING_HISTORY, aggregated by user, role, and warehouse. It worked for about three months.
Then BigQuery showed up in the stack, the dashboard we built had to be redone, and we hit the realization that hits every team that builds its own cost tool: the data sources are the easy part. What's hard is the workflow on top of them. This is the deep analysis of what we built, what we got right, and where we burned engineering time we wish we'd kept.
What is a cloud data warehouse cost optimization tool?
A cost optimization tool, in this context, is software that aggregates usage data from a cloud data warehouse or equivalent, attributes spend to teams or workloads, surfaces patterns that suggest waste, alerts when something unusual happens, and can remediate the excessive spend. The category exists because the native billing dashboards in Snowflake, BigQuery, and Databricks are a guide for the data team to read once a month, not for engineers to act on in real time.
A useful comparison: think of a cost optimization tool as the difference between a credit card statement and a personal finance app. The statement tells you what you spent. The app tells you which subscriptions you forgot about, alerts you when a charge is unusual, and projects next month's spend based on the current trend. Both pull from the same underlying data; the value is in the workflow on top.
The 80/20 rule of the Pareto pattern
DIY cost tools follow the Pareto pattern. Roughly the first 80% of usable value comes from a small slice of the work: a few SQL queries against native usage views will surface the obvious spending. The remaining 20% of value (anomaly detection, attribution that survives org changes, optimization recommendations) is where 80% of the engineering investment lives. Most DIY projects ship the easy slice and never finish the hard one.
Why teams build their own and why most end up regretting it
Three reasons usually drive the build decision.
- First, off-the-shelf tools feel expensive relative to the spend they're supposed to manage. A team spending $30K a month on Snowflake looks at a $24K-a-year cost optimization platform and does the math the wrong way.
- Second, the data sources look accessible. The native usage views are right there. How hard could it be?
- Third, building a tool feels like you control the outcome. You own the source code, you can customize it, and you can fix what you don't like.
All three intuitions are correct as far as they go. The trap is that the build phase ends, the maintenance phase begins, and the maintenance phase never ends. Every quarter, Snowflake adds new metering views or BigQuery deprecates a column. Every reorg breaks attribution. Every new platform doubles the surface area. The team that built the tool for $30K of monthly spend is still maintaining it when spend hits $300K, on a tool that wasn't designed for that scale.
Why do Snowflake bills spiral out of control?
The silent cost drivers: Compute, storage, and concurrency scaling
Three patterns drive most cost regressions. First, compute scales silently. A multi-cluster warehouse configured to scale up to 5 clusters is fine when traffic is steady, but a single bad query running concurrently across all clusters can 5x credit consumption for the duration. Few teams have alerts on cluster scaling events, so the spike often shows up only on the next day's invoice review.
Lack of visibility in cloud cost monitoring across teams
Visibility fragments by organization function. The data team owns the warehouse, the analytics team writes the queries, and finance reviews the bill. Each group sees a different slice. The data team sees credits-per-warehouse, analytics sees query latency, and finance sees a number. None of them sees the user-attributed, query-level breakdown that would actually let you find the responsible party for a cost spike.
How poor query hygiene inflates Snowflake bills overnight
A single query with a Cartesian join (a join with no condition, which produces every combination of rows from both sides, almost always a mistake), a missing partition predicate, or a runaway recursive CTE can burn hundreds of credits before anyone notices. We've seen a single DBT model with an unintended cross-join cost more in 24 hours than the rest of that team's monthly Snowflake spend. There was no alert because the query succeeded. Snowflake doesn't fail expensive queries; it just runs them. Snowflake cost optimization covers the systematic playbook for managing these drivers.
What are the key Snowflake cost optimization tools on the market?
Native features vs. third-party snowflake cost optimization tools
Snowflake's native tooling is the starting point. Resource Monitors let you set credit quotas per warehouse and trigger suspension when limits are hit. The QUERY_HISTORY view exposes per-query credit consumption with user attribution. The Cost Insights dashboard in Snowsight gives a baseline view of monthly spend. For small teams with stable workloads, this is often enough.
What the best cloud cost optimization tools actually solve
Native tooling stops short in automation, alerting, and remediation. Resource Monitors are static thresholds; they don't detect anomalies relative to baseline. QUERY_HISTORY is a query-by-query log; it doesn't surface "this query cost 50x its baseline" patterns. Cost Insights is descriptive, not prescriptive. Third-party tools fill different parts of the gap. Some focus on attribution, some on optimization recommendations, some on anomaly detection. The best of them combine all three with continuous monitoring rather than periodic snapshots.
Gaps in automation, alerting, and real-time insights
The gap most DIY teams underestimate is real-time alerting. A cost spike caught on Monday morning when reviewing Friday's invoice is a different problem than one caught at 2 AM when the runaway query started. Real-time anomaly detection requires streaming the cost telemetry to a monitoring layer, which is itself a non-trivial engineering investment. Most teams that try to build this skip it for v1, then never come back to add it. Avoiding snowflake data cost pitfalls covers more on what gets missed in DIY tooling.
How does BigQuery cost optimization differ, and when do you need a separate tool?
Pricing model differences: Snowflake vs. BigQuery explained
The structural difference matters more than the surface-level price comparison. Snowflake bills by warehouse-hour: you pay for compute time, regardless of whether queries are scanning much data. BQ is by slots.
Query-based billing and its impact on BigQuery cost optimization
The implication for a cost tool: the metrics that matter are different. On Snowflake, warehouse utilization is a key signal. A warehouse running at 20% utilization wastes credits. On BigQuery, that metric is meaningless; what matters is bytes scanned per query and partition pruning effectiveness. A cost tool built around Snowflake's model doesn't translate.
When a unified vs. specialized cost tool makes sense
BigQuery's slot reservation model adds another layer. Teams that move from on-demand to flat-rate slots get predictable monthly costs but lose the per-query attribution that on-demand provides. A tool designed for on-demand BigQuery accounting often can't represent slot-based usage cleanly.
A unified tool makes sense when teams use both platforms and want a single dashboard for executives. A specialized tool wins when one platform dominates spend, and the team needs deep optimization recommendations specific to that platform's mechanics. We've seen teams adopt unified tools, hit the limits of their depth on the dominant platform, and then layer a specialized tool on top, paying for both.
Can a DIY cost management tool really work? Our build story
Why we decided to build a DIY cloud cost tooling solution
We started because the off-the-shelf options at the time felt expensive relative to our spend. Building seemed cheap. We already had data engineers, the source views were exposed, and the requirements were clear: per-team attribution, anomaly alerting, and week-over-week trending.
Architecture choices, data pipelines, and early wins
The architecture was straightforward. A scheduled task pulled QUERY_HISTORY and WAREHOUSE_METERING_HISTORY hourly into a dedicated Snowflake schema. A dbt project (dbt is a SQL-based transformation framework) transformed it into team-attributed cost facts using warehouse naming conventions and role mappings. A Looker dashboard exposed the results. Anomaly detection was a SQL query: this hour's spend versus the same hour last week, alerting if the delta exceeded 2x. This worked well for about three months. We caught two genuine cost spikes early. The dashboard became the single source of truth for cost reviews.
Where the DIY cost management tool started breaking down
Then the cracks started showing. The first crack was BigQuery. We added a Google Cloud project, the schema didn't translate, and we had to build a parallel pipeline. Two cost models, two schemas, two anomaly definitions.
The second was alert quality. Our 2x threshold caught some real spikes but also fired on legitimate seasonal traffic, on Mondays after weekends, and on month-end batch processing. We built suppression logic. It got complex. The alerting system needed its own monitoring.
The third was attribution. As teams reorganized, our hardcoded warehouse-to-team mappings drifted. We added a config file. The config file became its own source of truth that needed governance. Suddenly, the small internal tool had configuration management requirements. The maintenance load was higher than we'd planned, and growing.
The pattern we kept hitting
Every quarter, the tool needed work that wasn't obvious at build time. Snowflake added new metering views; we updated schemas. The org changed; we updated mappings. A new platform showed up; we built another pipeline. The tool was never done.
Lessons learned: DIY hidden costs vs. purpose-built platforms
Engineering time vs. actual savings: The trade-off reality
A candid accounting of the engineering investment: the initial build took two engineers six weeks. Maintenance averaged twenty percent of one engineer's time over the following year, covering pipeline failures, schema additions, alert tuning, and attribution updates. That works out to roughly 0.6 FTE-years (full-time equivalent, the standard measure of sustained engineering load) over the first eighteen months. At fully loaded engineering cost, the total lands in six figures. Did it save money? Yes. The spike alerts surfaced real issues. But the savings tracked closely with what a purpose-built tool would have caught at a fraction of the investment.
Maintenance overhead and scaling challenges
The maintenance overhead is the dimension DIY discussions usually understate. Every new platform (BigQuery, Databricks, Redshift) is another full pipeline. Every Snowflake feature change is a schema migration. Every org change is an attribution update. The work doesn't peak at launch; it grows as the surface area grows.
Why purpose-built snowflake cost optimization tools outperform DIY
Purpose-built tools win on three specific things. First, breadth: they support multiple platforms with a unified data model that we'd have to build ourselves. Second, depth: optimization recommendations like "this warehouse is over-sized for its workload" require platform-specific heuristics that take months to build well. Third, anomaly detection that handles seasonality, cross-team patterns, and false-positive suppression out of the box.
DIY still makes sense when you need a custom integration that no vendor supports, or when your spend is small enough that the cheapest off-the-shelf tool doesn't pencil out. Otherwise, the math usually favors buying.
What you actually get: Native vs. DIY vs. purpose-built
Where we landed
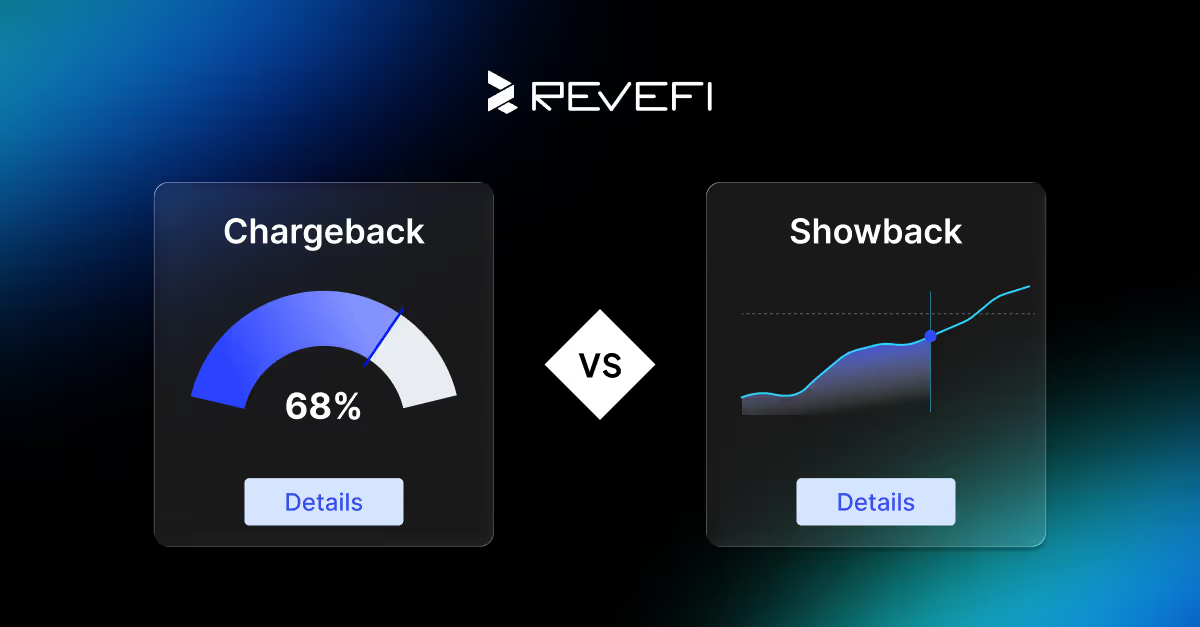
We didn't tear our internal tool out. The team had built genuine value into it, and the seasonal-aware alerting we'd developed was specifically tuned to our workloads. But for the breadth of platform coverage, the depth of optimization recommendations, and the maintenance offload, we layered a purpose-built platform on top. Our internal tool became the chargeback engine for our specific organizational needs, and the purpose-built layer handled multi-platform observability and optimization recommendations.
FinOps Snowflake cost optimization covers the broader pattern. The practical answer for most teams is somewhere between full DIY and full vendor. The question is which parts you keep building yourself and which you buy.