Key takeaways
- Latency and cost are usually the same problem with two faces. Fix the data layout and both improve.
- Most pipelines have one or two dominant cost drivers; find them before optimizing the rest.
- Right-sizing compute is the single highest-impact change for most pipelines.
- Workload orchestration matters as much as the work itself. Serialized stages cost more than parallel ones.
- AI-assisted optimization is real, but only effective when foundational metrics are already in place.
Ask a DataOps team where their time goes, and the data pipeline lands at or near the top of the list. It's consistently one of the hardest parts of the stack to keep fast, cheap, and reliable at the same time. That's why pipeline optimization conversations usually start with one of two complaints: the pipeline is too slow, or the pipeline costs too much. The thing nobody tells you in either case is that the same fixes often address both, and the same misdiagnoses make both worse.
A pipeline that costs too much because it's running 4XL warehouses is also slow because the data is poorly partitioned. A pipeline that's too slow because of unnecessary serialized stages is also expensive because each of those stages spins up its own compute. The optimization work isn't separate latency-versus-cost workstreams; it's one workflow with two outputs. This guide walks through how to do it properly, which signals to track, and where the cheap wins actually live.
What is data pipeline optimization?
A data pipeline is the path data takes from a source system to a place where it is useful, like a dashboard, a model, or a downstream service. Pipeline optimization is the practice of making that path faster, cheaper, or more reliable, ideally all three. The work spans the four layers any modern pipeline contains: ingestion (how data gets in), transformation (the SQL, code, or framework that reshapes it), storage (intermediate and final tables), and orchestration (the scheduler and dependency graph).
Useful comparison: think of a pipeline like a postal route. Ingestion is package pickup. Transformation is sorting at the regional center. Storage is the warehouse where packages wait between stages. Orchestration is the schedule that decides when each truck leaves. Optimizing the route doesn't mean making the trucks faster. It means picking up smaller loads more efficiently, sorting fewer packages twice, keeping less inventory in the warehouses, and not leaving trucks idling between routes.
Common inefficiencies in data pipelines
In production pipelines, a small number of patterns account for most performance problems. Full table scans where partition filters would prune to a fraction of the data. Unnecessary materializations (writing intermediate results to a table when a view would do) that double the storage cost without speeding anything up. Serialized DAG stages where parallelism was possible. Compute warehouses sized for the worst-case query in the pipeline rather than the median. Each of these is identifiable from telemetry; none requires architectural rewrites to fix.
A useful diagnostic question
Before optimizing, ask: what is the dominant cost in this pipeline? Compute? Storage? Data movement? Most teams skip this question and start tuning whatever they noticed first. The answer almost always points to one or two specific stages, not the pipeline as a whole.
Benefits of optimizing data pipelines
Latency reduction maps directly to user experience: the data freshness contract you've made with downstream consumers. Cost reduction maps to the budget. The benefit you don't usually account for is reliability. Efficient pipelines fail less often because they spend less time running, hold fewer locks, and contend less with other workloads. Reliability gains from pipeline optimization are real but usually invisible until you compare incident rates before and after. Data observability covers the fundamentals.
Why does latency matter in modern stacks?
Impact of latency on real-time analytics
Real-time pipelines pay a structural cost premium. Continuous ingestion, micro-batched transformation, and always-on serving compute all run at higher per-hour costs than equivalent batch workloads. This is justified when downstream consumption is real-time. A fraud detection system needs sub-second latency. It's not justified for dashboards refreshed once per hour, even if the technology exists to update them every five seconds.
Batch vs. real-time latency trade-offs
The honest framing isn't batch versus streaming; it's "what's the actual freshness requirement, and what's the cheapest pipeline architecture that meets it?" A 15-minute micro-batch often delivers 95% of the value of true streaming at 30% of the cost. Going from 15 minutes to 1 minute typically doubles the cost. Going from 1 minute to 1 second can quadruple it. The cost curve is non-linear; freshness requirements should reflect that.
How latency affects user experience and SLAs
Latency budget setting is more useful than latency optimization in isolation. If your SLA (service level agreement, the formal commitment to data freshness or uptime) is 30-minute freshness and you're running at 5 minutes, you're paying for performance nobody asked for. Setting an explicit freshness contract per dataset reveals which pipelines are over-provisioned and which ones are at risk of missing their target. The over-provisioned ones are usually the easier optimization wins.
Key cost drivers across cloud data pipelines
Compute costs and inefficient query execution
On Snowflake, Databricks, and BigQuery, compute typically accounts for 70–85% of pipeline cost. Within computing, the biggest waste is oversized warehouses or clusters running underutilized. A 4XL warehouse running a query that would run on an L is paying 4x the credit rate for a marginal performance gain. On Databricks, an all-purpose cluster handling jobs that should run on a job cluster pays roughly 2 to 3x the per-DBU rate (DBU stands for Databricks Unit, the platform's compute billing unit) for no operational benefit.
Storage costs and data duplication issues
Storage is rarely the headline cost, but pipelines accumulate it silently. Intermediate transformation tables, debug snapshots, and historical materializations stack up. A pipeline that materializes a 500GB intermediate table and never drops it costs the storage equivalent of $12–20 per month indefinitely. Across 50 such pipelines, that's a meaningful line item. Setting retention policies on intermediate tables is one of the easiest cost wins available, and it's often missed because nobody owns intermediate storage explicitly.
Data movement and egress cost challenges
Cross-region data transfer is the cost surprise that catches teams that didn't plan for it. A pipeline reading from S3 in us-east-1 and writing to a Snowflake account in us-west-2 pays cross-region egress on every transfer. At $0.02 per GB, a daily 1TB pipeline costs $600 per month in transfer alone. Co-locating compute and storage in the same region eliminates this entirely. Read how AI is transforming data engineering to know more about emerging optimization patterns.
How do you reduce latency without blowing up cost?
Right-sizing compute resources
The single highest-impact change. Most pipelines run on warehouses sized for peak load, not steady-state load. Profiling individual stages and matching compute size to actual demand reduces cost without affecting peak throughput when properly configured.
On Snowflake, test the same workload on warehouses one and two sizes smaller; if the runtime impact is acceptable, the cost savings are immediate (each size down halves the credit rate). On Databricks, the equivalent is matching cluster instance type and count to actual workload memory and CPU profiles.
The moving truck principle
Right-sizing is like renting a moving truck. The biggest available truck always finishes the job, but you're paying for a 26-foot truck to move a one-bedroom apartment. The right-sized truck does the work for half the cost in roughly the same time. The same logic applies to warehouses and clusters.
Optimizing data partitioning and indexing
Pipeline stages reading partitioned tables should always filter on the partition key. A full table scan on a 5TB partitioned table reads 5TB; a partition-pruned scan reads what the filter selects. The runtime difference is 10 to 100x; the cost difference is identical. Reviewing every stage's predicate against the table's partition strategy is a one-pass audit that often surfaces multiple wins.
Scheduling and workload orchestration strategies
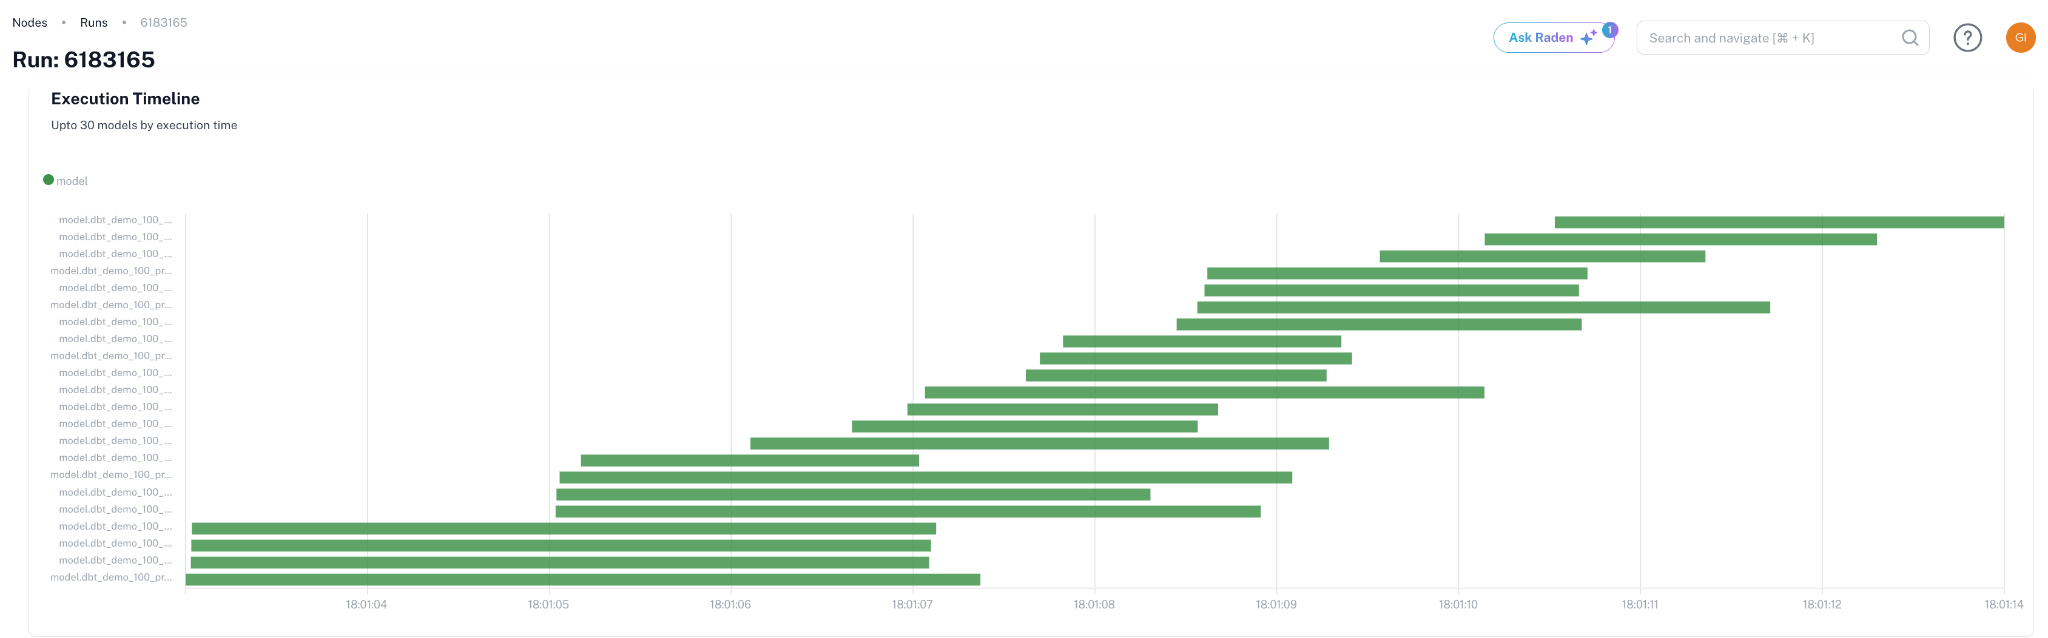
Two specific patterns matter most. First, parallelize independent stages. Most DAGs (directed acyclic graphs, the standard structure for representing pipeline dependencies) have unnecessary serialization where parallelism was possible. Identifying parallelizable stages cuts wall-clock latency without adding compute, because the work runs concurrently rather than sequentially. Second, batch related work together. A pipeline that runs 50 small queries, each spinning up a warehouse, pays the warehouse-resume overhead 50 times; consolidating into 5 larger queries pays it 5 times.
Tools and techniques for continuous optimization
Automation tools for pipeline performance tuning
The most useful automation isn't full-pipeline optimization; it's targeted automation on specific patterns. Automated warehouse right-sizing based on historical usage is reliable and high-impact. Automated query performance regression detection catches new pipelines that ship with bad partition predicates. End-to-end "AI optimizes your pipeline" pitches usually overpromise; targeted automation on specific patterns delivers more reliably.
Query optimization and caching techniques
Result caching, materialized views, and incremental processing each address specific workload shapes. Result caching helps when the same query runs repeatedly, common in BI dashboards. Materialized views (precomputed query results stored as tables) help when expensive aggregations are read more often than they're updated. Incremental processing helps when source data updates a small percentage of rows per run; reprocessing only the deltas is dramatically cheaper than full reprocessing.
Leveraging AI for pipeline optimization
AI for pipeline optimization works best as a recommendation engine on top of established telemetry, not as autonomous automation. AI models trained on query history can suggest warehouse sizing, identify wasteful query patterns, and predict which pipelines will exceed their SLA. The catch is that the models need clean telemetry to be useful; pointing AI at unlabeled, unattributed data produces unreliable recommendations. GenAI-augmented data engineering covers more on where AI fits in the optimization workflow.
Optimization levers across the three major platforms
Monitoring metrics: Are you measuring the right signals?
Key latency and throughput metrics to track
Pipeline latency is best tracked at three layers: end-to-end (when did fresh data become available downstream), per-stage (where is the time spent), and queue depth (how much work is backed up). The first answers SLA questions; the second answers optimization questions; the third answers capacity questions. Monitoring tools that track only end-to-end latency will catch missed SLAs but won't tell you where to fix them.
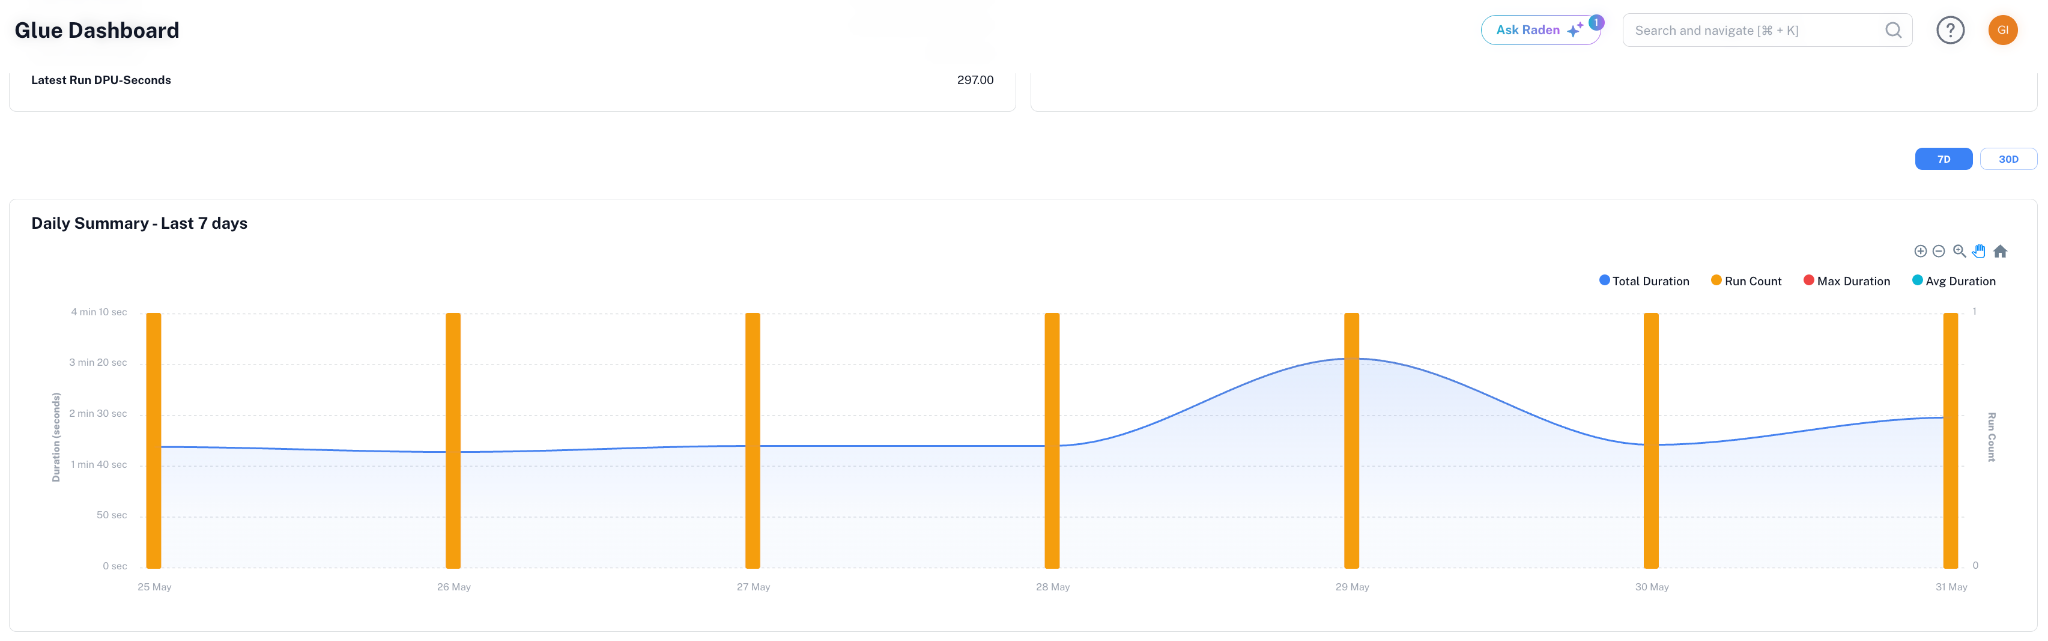
Cost observability and spend attribution
Cost per pipeline run, cost per dataset produced, and cost per consumer query are the three attribution levels worth tracking. Cost per run identifies inefficient pipelines. Cost per dataset identifies datasets that aren't worth maintaining. Cost per query identifies expensive downstream consumers. Most teams track one of the three; tracking all three exposes optimization opportunities that single-level metrics miss.
Alerting and anomaly detection best practices
Threshold alerts work poorly on pipeline metrics because pipelines have legitimate variance. Month-end runs are larger, holiday traffic dips, and schema changes cause one-off spikes. Anomaly detection that learns the baseline pattern and alerts on deviation handles these correctly; static thresholds either alert too often or miss real regressions. The implementation pattern matters: per-pipeline baselines outperform global thresholds.
A common mistake
Setting a single global cost threshold for all pipelines guarantees that the threshold is wrong for each of them. The expensive batch pipeline triggers false positives daily; the small streaming pipeline never triggers when it should. Per-pipeline baselines are the only configuration that scales.
How continuous pipeline observability fits the workflow
Continuous pipeline optimization requires telemetry that survives platform updates, attribution that survives org changes, and recommendations that match the platform-specific mechanics described above. A read-only metadata approach handles all three across Snowflake, Databricks, and BigQuery, surfacing pipeline-level cost and latency anomalies in real time and providing the platform-specific recommendations (warehouse sizing on Snowflake, cluster policy on Databricks, partition strategy on BigQuery) that matter for each engine. The operational pattern is the same one teams build internally with their DIY tooling, but with multi-platform support and a maintenance offload that DIY can't match at scale.