.avif)
Data pipelines often tend to break quietly! Schema changes go unnoticed, “successful” jobs deliver incorrect outputs, and critical dashboards run on stale data for weeks.
These are not outlier cases, but rather common realities in modern enterprise data ecosystems.
As organizations scale AI initiatives, real-time analytics, and customer-facing applications, data environments have become more complex, distributed, and business-critical. This complexity introduces risk, making data reliability, data quality, and pipeline health visibility essential for operational success. Hence, data observability has emerged as the solution.
This guide is designed for data leaders, engineers, architects, and procurement teams evaluating observability platforms. It combines Gartner’s 2026 market insights, current adoption trends, and a practical perspective on how data observability works (and where it’s headed).
What Is Data Observability?
Data observability is the ability to continuously monitor, analyze, and ensure the health, quality, and reliability of data across pipelines, platforms, and downstream applications.
Gartner defines data observability tools as platforms that enable organizations to understand the state, performance, and cost of data ecosystems (including pipelines, infrastructure, and distributed data environments). These platforms provide continuous monitoring, anomaly detection, alerting, and root cause analysis to identify and resolve data issues before they impact business outcomes.
The keyword here is “continuous”.
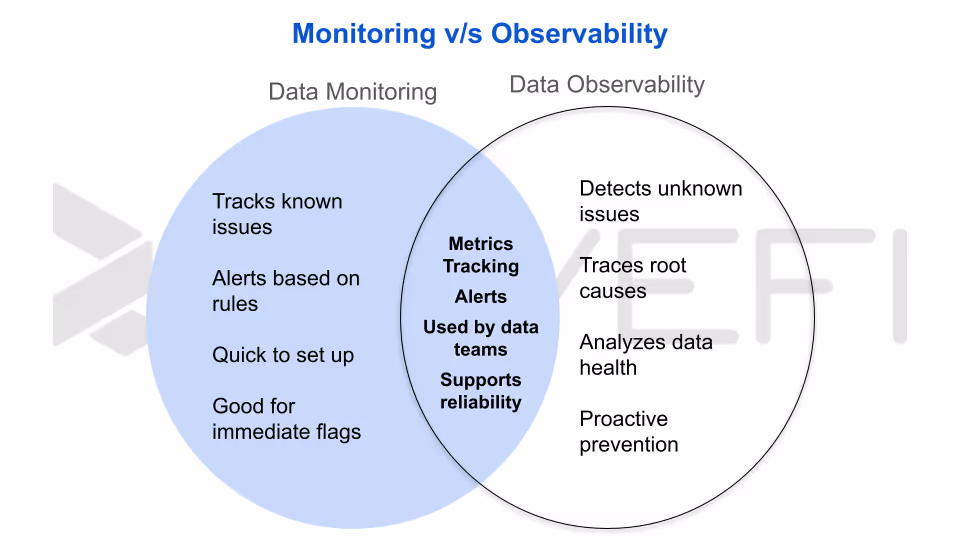
Traditional data monitoring and data quality tools rely on static rules, scheduled checks, and predefined thresholds. They only detect issues explicitly configured to be found, an approach that struggles in today’s dynamic, large-scale data environments.
Modern data observability platforms take a more intelligent, automated approach. They establish baselines for “normal” behavior across pipelines, datasets, and infrastructure, then use those baselines to detect anomalies (including issues no rule was designed to catch).
More importantly, observability goes beyond just traditional alerting. It correlates signals from logs, metrics, and data lineage to provide context, thereby helping teams quickly understand:
- What broke?
- Why did it happen?
- Which downstream systems or business processes are affected?
That’s the fundamental shift, from reactive monitoring to proactive, intelligent data observability.
Why 2026 Marks a Defining Moment for Enterprise Data Observability?
Data observability has rapidly transitioned from early adoption to near-universal deployment.
According to the same Gartner report, an additional 31% plan to deploy within the next 6–12 months, while 12% expect adoption within 12–18 months. In practical terms, this signals full-market penetration within a two-year window.
Market growth reinforces this trajectory. Experts reported a 20.8% increase in 2024, reaching approximately $346.4 million. Broader industry estimates the market will expand to $3.51 billion in 2026 and grow to $6.03 billion by 2031 (clear evidence of sustained enterprise investment and long-term strategic prioritization).
Three converging trends are elevating data reliability to the executive agenda
1. AI readiness and governance requirements
Enterprise AI, including generative and agentic systems, depends entirely on the quality and integrity of underlying data. Poor data introduces bias, accelerates model drift, and in autonomous AI environments, can trigger compounding operational errors with significant business impact. Continuous monitoring (especially for semantic drift) is now essential. As AI governance frameworks evolve, data observability is becoming a foundational control layer rather than an optional enhancement.
2. Increasing complexity of modern data architectures
Today’s enterprise data ecosystems span multi-cloud warehouses, real-time streaming pipelines, transformation layers, on-prem systems, and AI inference platforms. Traditional monitoring tools, which rely on predefined rules and known failure conditions, struggle to keep pace with this level of complexity. Data observability platforms, by contrast, are designed to detect unknown anomalies and provide end-to-end visibility without requiring predefined expectations.
3. Rising demand for cloud cost transparency and FinOps alignment
Escalating cloud data warehouse costs (combined with the unpredictable spend associated with generative AI workloads) are driving CFOs and IT leaders to demand precise cost attribution. Organizations now require clear visibility into how data spend maps to teams, projects, and business outcomes. Data observability platforms that incorporate financial observability capabilities are increasingly critical for meeting enterprise FinOps objectives and enforcing budget accountability.
Organizations that actively measure data downtime, which are periods when data is incomplete, inaccurate, or unavailable, consistently find it more frequent and more expensive than traditional infrastructure downtime. This makes data observability not just a technical investment, but a critical business safeguard.
Data Observability vs. Data Quality: Why the Difference Is Critical for Modern Data Teams
Enterprise data leaders evaluating observability platforms often blur the line between data observability and data quality solutions. While the two are closely related, treating them as interchangeable leads to misaligned tooling decisions, incomplete coverage, and gaps in data reliability strategy.
Data quality focuses on the integrity of the data itself
Data quality solutions operate at the dataset level, ensuring that information meets defined business rules and standards. They validate whether values are accurate, fields are complete, and records are free from duplication or inconsistency. Core capabilities include data validation, profiling, and remediation. In simple terms, data quality answers one key question: Is the data correct and fit for use?
Data observability provides end-to-end visibility into the data ecosystem
Data observability takes a broader, system-level approach. It monitors not only the data, but also the pipelines, transformations, infrastructure, usage patterns, and even cost drivers behind it. Instead of relying solely on predefined rules, observability platforms establish baselines for normal behavior and automatically detect anomalies or deviations.
This enables teams to answer more complex operational questions: Is the data ecosystem functioning as expected? If not, what broke, where, and what is the downstream impact?
Overlap exists, but the roles are fundamentally different
Both data observability and data quality share capabilities such as data profiling, metadata analysis, content monitoring, and lineage tracking. However, leading analysts like Gartner position them as complementary (not interchangeable) disciplines.
For enterprise procurement and architecture planning, this distinction matters. Data observability is not simply a more advanced version of data quality tooling. It addresses operational reliability, system health, and root cause analysis, requiring its own evaluation criteria and implementation strategy.
How data observability differs from APM tools?
It’s also important to separate data observability from application performance monitoring (APM). APM tools focus on application and infrastructure metrics such as latency, error rates, and system uptime. They do not provide visibility into data-specific attributes like freshness, accuracy, lineage, or cost efficiency.
To build a resilient, AI-ready data stack, organizations need both data quality and data observability. Data quality ensures the data is trustworthy, while data observability ensures the systems delivering that data are reliable, transparent, and accountable at scale.
The Five Pillars of Data Observability
Gartner’s 2026 Market Guide for Data Observability defines five core pillars that together form a comprehensive framework for evaluating modern data observability platforms. Understanding these categories helps enterprise teams assess vendor capabilities, define technical requirements, and ensure complete coverage across complex data ecosystems.
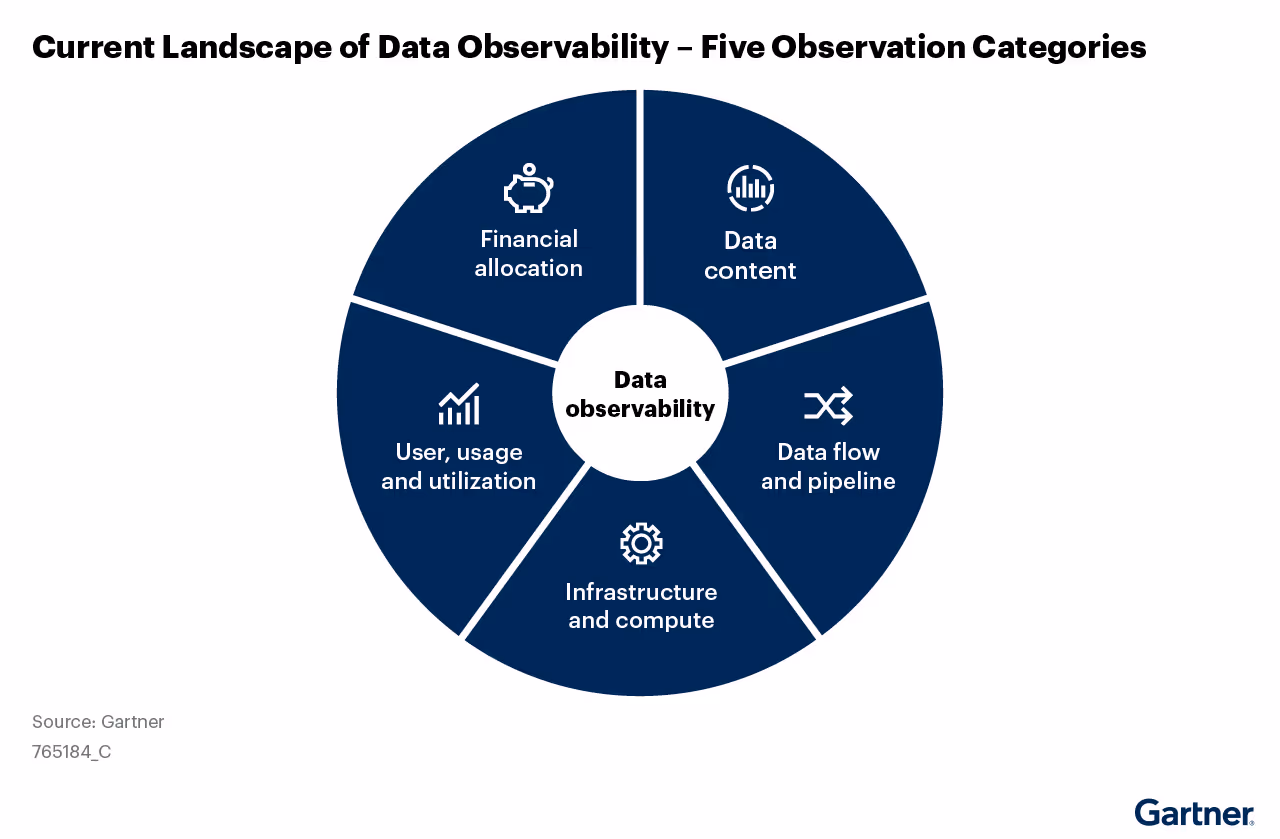
1. Data Content Observability
This dimension focuses on the quality and integrity of the data itself. It monitors key metrics such as:
- Accuracy
- Completeness
- Consistency
- Uniqueness
Advanced platforms also profile statistical distributions to detect unexpected changes, track schema and volume shifts, and flag anomalies against defined business rules.
For large enterprises, data content observability acts as an early warning system, preventing silent data issues from cascading into dashboards, AI models, or compliance reports. It is especially critical for organizations operating under regulatory frameworks like GDPR, HIPAA, CCPA, and SOC, where data accuracy and traceability are mandatory.
2. Data Pipeline and Flow Observability
This dimension tracks how data moves through pipelines and whether those processes are functioning reliably. It includes monitoring ETL/ELT job execution, measuring runtime performance, ensuring SLA compliance, and detecting schema or code drift across pipeline stages.
Data lineage tracking is a key capability here, enabling teams to trace data from source to destination and quickly identify the root cause of failures. In modern environments that rely on tools like Airflow, dbt, Fivetran, and Azure Data Factory, pipeline observability provides unified visibility across systems.
More importantly, it answers deeper operational questions: Did the pipeline deliver accurate, complete, and timely data and what downstream systems are impacted if it didn’t?
3. Infrastructure and Compute Observability
Infrastructure observability ensures that the underlying data platform resources (compute, storage, and network) are operating efficiently and within acceptable thresholds. It monitors workload performance, tracks resource utilization, and forecasts future capacity needs.
For organizations running large-scale cloud data warehouses, this dimension supports capacity planning, SLA management, and performance optimization. It also helps prevent resource contention, which can lead to pipeline slowdowns or failures.
4. User, Usage, and Data Utilization Observability
This dimension provides visibility into how data is accessed and consumed across the organization. It tracks dataset ownership, query frequency, and usage patterns at the table and column level, while also identifying deviations from normal behavior.
Usage observability plays a critical role in multiple areas:
- Data governance:
Identifies who is accessing sensitive or regulated data - Data optimization:
Highlights underutilized or unused datasets - Incident management:
Reveals which users, teams, or business units are affected by data issues
Without this visibility, organizations struggle to assess impact or prioritize remediation effectively.
5. Cost Allocation and Financial Observability
As cloud data costs rise and AI workloads introduce unpredictable spending patterns, financial observability has become a core requirement for enterprise data teams. This dimension analyzes the cost associated with datasets, pipelines, and workloads, and attributes that spend to specific teams, projects, or business units.
It also detects cost anomalies, supports chargeback and showback models, and enables FinOps reporting. With the growing adoption of generative AI and agent-based systems (where usage patterns are less predictable) organizations increasingly rely on financial observability to maintain budget control and accountability.
These five pillars:
- Data content
- Pipeline flow
- Infrastructure
- Usage
- Cost
Collectively define a modern, enterprise-grade data observability strategy. Organizations that evaluate platforms against this framework are better positioned to ensure data reliability, optimize performance, and maintain financial control in increasingly complex, AI-driven environments.
How AI Is Transforming Data Observability Platforms
The integration of Artificial Intelligence (AI) and Generative AI (GenAI) into data observability platforms is rapidly redefining the category. For enterprise buyers, AI-driven capabilities are now a primary evaluation criterion, shaping how organizations monitor, manage, and scale data reliability.
According to Gartner, AI augmentation is a key driver of innovation in data observability, with ongoing advancements in predictive analytics, anomaly detection, and automated remediation. In practice, this evolution is most visible across four critical capabilities that distinguish modern platforms from legacy tools.
1. Automated Baseline Learning Without Manual Rules
Traditional monitoring systems rely on manually defined thresholds and rules, which are difficult to maintain at scale. AI-powered observability platforms eliminate this bottleneck by using machine learning models to continuously learn what “normal” looks like across datasets, pipelines, and infrastructure.
As data patterns evolve, these models dynamically adjust thresholds, ensuring accurate anomaly detection without constant human intervention. For large enterprises managing thousands of data assets, automated baseline learning is not optional; it is essential for achieving comprehensive coverage and scalability.
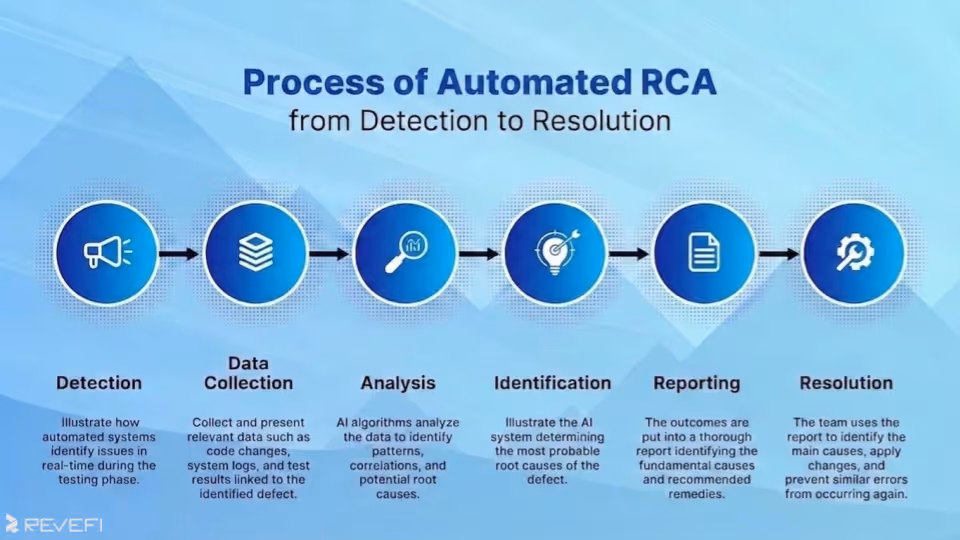
2. Accelerated Root Cause Analysis (RCA)
When data issues arise, speed matters. AI-enabled observability platforms correlate signals across logs, metrics, and data lineage to quickly identify the root cause of anomalies. This includes distinguishing between upstream data source issues, transformation errors, orchestration failures, or infrastructure constraints.
What previously required hours of manual troubleshooting can now be resolved in minutes. This significantly reduces Mean Time to Detection (MTTD) and Mean Time to Resolution (MTTR), which are two key performance metrics for modern data engineering teams.
3. Predictive Alerting and Proactive Issue Prevention
Instead of reacting to failures after they occur, advanced data observability platforms leverage predictive analytics to identify risks before they impact operations. These systems can detect early warning signals such as:
- Capacity constraints that may delay pipeline execution
- Data delivery SLAs trending toward breach
- Cost spikes approaching budget limits
For organizations with strict service-level agreements, this shift from reactive monitoring to proactive prediction is operationally critical, helping prevent downtime and maintain data reliability.
4. Natural Language Interfaces for Observability Insights
Generative AI is also improving accessibility through natural language query interfaces. Data leaders, analysts, and business stakeholders can now ask questions about data health, lineage, or incident status in plain English, without relying on specialized technical expertise.
This democratizes access to observability insights, reduces dependency on data engineering teams, and enables faster, more informed decision-making across the organization.
AI and GenAI are no longer optional enhancements in data observability, as they are now key foundational capabilities. From automated anomaly detection to predictive insights and conversational interfaces, AI-driven observability platforms enable enterprises to move from reactive monitoring to proactive, intelligent data operations at scale.
What Enterprise-Scale Data Observability Requires
Implementing data observability at enterprise scale goes far beyond basic monitoring. It requires a combination of deep integrations, flexible deployment models, strong security controls, and a clear understanding of total cost of ownership (TCO). These factors are critical when evaluating platforms for complex, global data environments.
The value of a data observability platform is directly tied to how well it integrates with your existing data stack. Gartner highlights integration coverage as a key evaluation criterion for enterprise buyers.
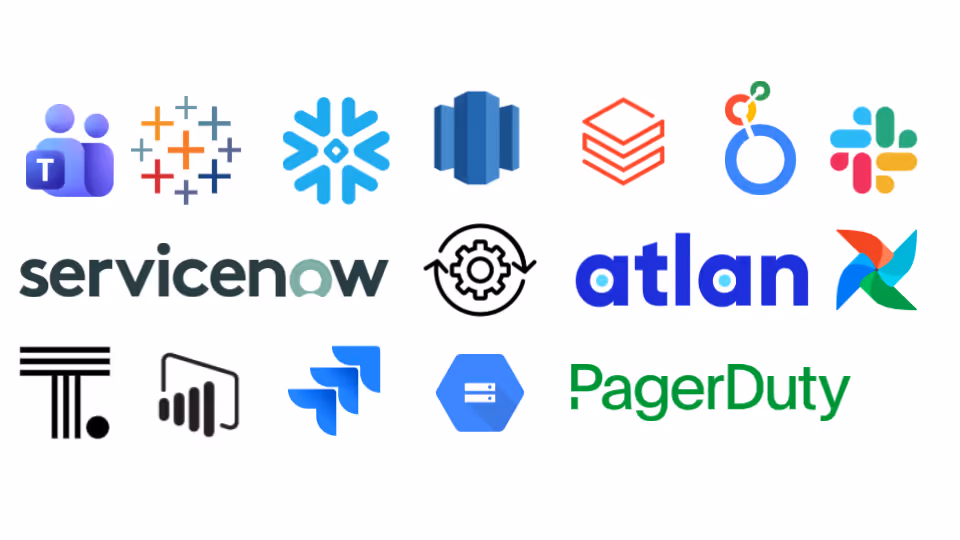
Modern data platforms are expected to natively integrate with:
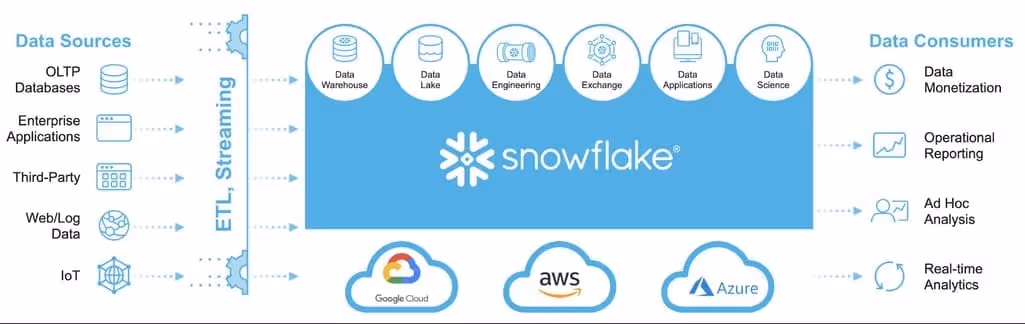
- Cloud data warehouses and lakehouses: Snowflake, Databricks, Google BigQuery, AWS Redshift
- Data integration and orchestration tools: Apache Airflow, dbt, Azure Data Factory
- Data catalog and metadata systems: Alation, Atlan, Microsoft Purview
- IT service management tools: ServiceNow, PagerDuty, Jira
- Business intelligence platforms: Tableau, Power BI, Looker, ThoughtSpot
- Collaboration tools: Slack, Microsoft Teams
Gaps in connector support often require custom engineering, which increases implementation time and long-term costs. Enterprise teams should evaluate integration depth against their specific architecture, not a generic feature checklist.
Deployment Flexibility for Diverse Environments
Enterprise data environments vary widely in cloud adoption, regulatory requirements, and security posture. A robust observability platform should support multiple deployment models, including:
- Public cloud SaaS
- Virtual private cloud (VPC) or private cloud
- Hybrid deployments spanning cloud and on-premises systems
- Containerized deployments for portability and control
Organizations operating under strict data residency or compliance frameworks (such as GDPR) must ensure deployment options align with regional data handling requirements before proceeding with vendor selection.
Security and Governance Readiness
Because data observability platforms connect to production systems and interact with sensitive metadata, enterprise-grade security and governance are non-negotiable.
Key capabilities to evaluate include:
- Role-based access control (RBAC)
- Audit logging and activity tracking
- Single sign-on (SSO) and SAML integration
- Encryption in transit and at rest
- Compliance certifications and third-party audits
It’s also important to understand the platform’s data access model, whether it reads actual data or relies on metadata and system telemetry, especially for organizations with strict data classification policies.
Total Cost of Ownership (TCO) Considerations
Pricing models in the data observability market vary significantly, and these differences can have major implications at scale.
Common pricing structures include:
- Consumption-based pricing:
Tied to data volumes, tables monitored, or alerts generated (can become unpredictable as data grows) - Tiered subscriptions:
Offer more predictable costs but require careful enterprise negotiation - SaaS vs. self-hosted models:
SaaS reduces operational overhead, while self-hosted deployments provide greater control but require internal resources
Gartner recommends evaluating TCO over a multi-year horizon, factoring in licensing, implementation, integration effort, ongoing support, and internal staffing (not just upfront costs).
Evaluating Data Observability Solutions: Key Criteria for Enterprise Buyers
A successful evaluation starts with a gap analysis, not a vendor shortlist. Identify where your current monitoring approach falls short, whether that’s missed SLAs, delayed issue detection, or excessive time spent on reactive troubleshooting.
Coverage Across All Five Observability Dimensions
Not all platforms provide full-spectrum observability. Some focus on data quality and pipelines, while others extend into infrastructure, usage, and cost monitoring.
For enterprises aiming to consolidate tooling and achieve a unified observability layer, broad coverage across all five dimensions (data content, pipelines, infrastructure, usage, and cost) is a critical differentiator.
Depth and Effectiveness of AI Capabilities
AI-driven features such as anomaly detection, root cause analysis, and predictive alerting directly impact operational efficiency. These capabilities should be validated during a proof of concept (POC), not assumed.
Best practice: define clear test scenarios in advance, such as:
- Injecting anomalies into pipelines
- Reproducing historical incidents for root cause validation
- Testing cost forecasting accuracy under real workloads
Integration with Your Existing Data Stack
Map your current ecosystem and require vendors to demonstrate native connector support and integration depth for each component. Any gaps should be clearly scoped for custom development before making a final decision.
Pilot-First Implementation Strategy
Gartner recommends starting with a focused pilot in a cloud environment, where integration is typically faster and time-to-value is highest.
A pilot covering two to three critical pipelines allows teams to:
- Validate platform capabilities
- Measure operational improvements
- Build a business case for broader rollout
Pricing Model Alignment with Growth
Understanding how pricing scales is essential. Model expected costs over a three- to five-year period based on projected data growth, usage patterns, and team expansion.
This ensures the selected platform remains cost-effective as your data ecosystem evolves.
Enterprise-scale data observability requires more than feature parity, as it demands deep integration, flexible deployment, strong governance, and predictable cost structures. Organizations that approach evaluation with a structured, requirements-driven framework are far more likely to select a platform that delivers long-term value, operational efficiency, and scalable data reliability.
Where Revefi Fits in the Modern Data Observability Landscape
Revefi is recognized as a representative vendor in Gartner’s 2026 Market Guide for Data Observability Tools, with coverage across all five core observability dimensions: data content, data pipelines, infrastructure and compute, user usage and utilization, and cost allocation. This comprehensive approach positions Revefi as a unified platform for enterprise-scale data reliability and performance management.
A Unified Approach to Observability Across the Data Stack
Revefi is built on the principle that the five dimensions of data observability are deeply interconnected. In real-world enterprise environments, issues rarely occur in isolation:
- A spike in cloud data costs may originate from a pipeline inefficiency
- A data quality issue may stem from infrastructure constraints or resource contention
The platform integrates natively with major cloud data warehouses like Snowflake, Databricks, BigQuery, and Amazon Redshift, as well as ETL and BI tools. It continuously monitors data freshness, schema changes, volume, and lineage. When anomalies are detected, Revefi analyzes logs, metrics, and traces to identify the source and assess downstream impact across dashboards, AI models, and business teams.
Revefi also includes robust financial observability, offering granular cost attribution and real-time anomaly detection to support FinOps practices. In 2026, it expanded into AI observability, providing visibility into the performance, cost, and reliability of LLMs and AI agents, ensuring end-to-end monitoring across the entire data-to-AI lifecycle.
Conclusion: Why Data Observability Is Now a Core Enterprise Requirement?
Data observability has become a foundational capability for large enterprises, not because it’s a passing trend, but because operating complex, high-impact data ecosystems without full visibility is no longer viable. As data environments grow more distributed and business-critical, organizations need continuous insight into what’s working, what’s failing, and why.
The market has matured to the point where Global 5000 companies are no longer asking whether to invest in data observability, but how to evaluate solutions, deploy them effectively, and measure business impact. Gartner’s 2026 Market Guide offers a practical framework, outlining the five key observability dimensions, capability benchmarks, and best practices for vendor evaluation.
For data leaders, the strategic priority is ensuring end-to-end coverage across the entire data ecosystem, including pipelines, data content, infrastructure, usage patterns, cost, and AI-driven systems. For data engineers and architects, success depends on deep integrations and reliable AI-powered root cause analysis. For procurement and program managers, it requires a structured evaluation process that validates real-world performance and accurately models total cost of ownership.