Key takeaways
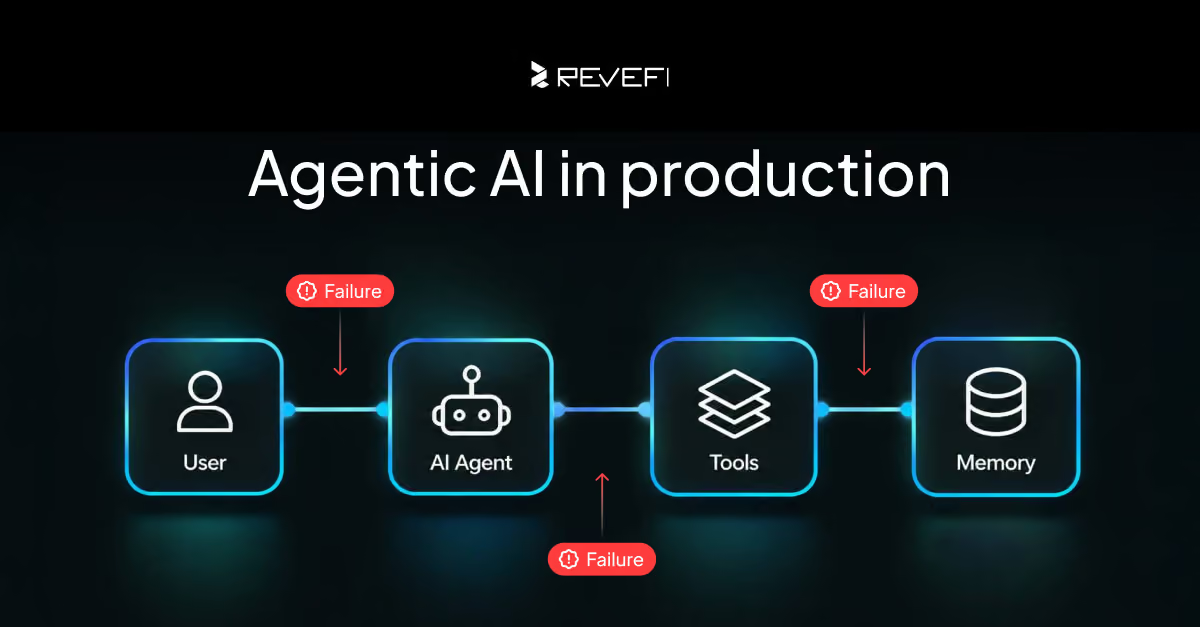
- Agentic systems fail across steps, not inside one call, so traditional ML monitoring cannot see the failure.
- Five modes recur, each with a paired signal, though the cheapest ones catch only loud failures.
- Every one of those signals only means something once it is aggregated above the model call, which is where existing monitoring stops looking.
- At a 5% per-step failure rate, a seven-step pipeline leaves up to about 30% of runs with at least one failed step.
- Instrument before you scale, because the retrofit cost lands on the team that inherits the code.
Visualize this: the pipeline passed every pre-deployment check, and three weeks into production, someone in support forwards a screenshot of an answer that is confidently, specifically wrong. Nothing errored and nothing paged. The run is logged as a success. The step that made it wrong is four steps upstream of the sentence in the screenshot.
Why agentic AI fails differently from single-model inference
An AI application takes one of two shapes. In a single-model system, a request goes to one model, which returns one answer in a single inference call. In an agentic system, a model works through a task across many steps, calling tools, retrieving data, and feeding each result into the next decision. A single-model call fails where you can see it, in the one input and the one output you already log. An agent run can return a right answer by a path that breaks the following week. Which one you are running is a design choice, and single-model stays the right call whenever one cheap, testable inference does the job.
Traditional ML monitoring (machine learning monitoring) catches problems inside one call: latency, error rate, and, for LLM (large language model) calls, token usage. It wasn't built for tool calls, context state, or errors that compound across steps.
That distinction changes what an incident looks like. With one call, the postmortem starts from an error, and the trace is the request. With a run, the error is often several steps upstream of the symptom, so the first question is which step to open before you can ask what went wrong. Teams that keep their existing alerting and add nothing else end up paging on the step that produced bad output, not the step that produced bad input, and the two are rarely the same step.
Four structural differences break traditional ML monitoring at this layer:
- State accumulates across steps. Context windows fill and history compounds. Working memory at step seven looks nothing like step one.
- External dependencies are invisible. Tool calls reach APIs (application programming interfaces), databases, and services that traditional ML monitoring never sees.
- Errors compound instead of surfacing. A small mistake at step two can become a confident wrong answer at step seven.
- Success is harder to define. A completed run isn't the same as a correct run.
Where the signal has to live
If a signal only fires on the final output, it can only catch runs that failed loudly. Every run that reached a plausible answer through a broken path looks identical to a good one. Assume any mode you cannot see at the step or tool call level is invisible to you in production, and instrument it there rather than at the end.
The five failure modes of agentic AI in production
Failure mode 1: Tool call failures
The causes are ordinary: an unavailable API, malformed arguments generated by the model, expired credentials, rate limit exhaustion. The handling makes them dangerous. Many frameworks retry silently or return null, so the pipeline continues and the error gets buried in a later output. Tracking says success. Everything downstream proceeds as if that were true.
Track tool error rate per step, per agent, and per tool type. That third dimension is the expensive one, since one series per tool per agent adds up fast and on a large fleet we sample it rather than hold full fidelity, and it is also the one that makes a 2 AM page triageable because it separates an API outage from a model generating bad arguments. The retry spike moves before the error count does, so that is what to alert on. You will usually have to produce that number yourself: silent means the framework swallows the error, not that it hides the attempt, so count call attempts per step at the tool client.
Failure mode 2: Context window exhaustion
Agents accumulate state at every step: prior tool results, prior model outputs, conversation history. When the context window fills, the framework truncates earlier content, and the agent continues with incomplete information. Some frameworks summarize instead, some drop oldest-first, and some raise an error. Confirm which one yours does before you trust the signal.
Context window utilization is content-blind. It tells you the window filled and never whether what got dropped mattered. Treat it as a starting signal, not a sufficient one. Where the framework truncates rather than raising, the output degrades with no error to catch, so alert at 70% and 90% of the model's limit until you have a per-agent growth rate to set it against, and spot-check the runs that cross.
Failure mode 3: Compounding errors across steps
An error at step N doesn't necessarily produce an error at step N+1. It produces a wrong input. The model at step N+1 can't know its input is wrong, so it processes it confidently and hands a further-degraded result to step N+2. No single step looks broken. By the final output, the error has been rewritten by several model calls where output inspection won't find it.
The compounding math
At a 5% per-step failure rate across a seven-step pipeline, about 30% of runs contain at least one failed step, because 1 minus 0.95 to the seventh power is 0.302. Push the same agent to ten steps, and 1 minus 0.95 to the tenth power gives 0.401. The calculation assumes steps fail independently. Real failures cluster, so treat 30% as the upper end for how many runs contain a failed step. Clustering concentrates the damage into fewer runs without reducing it. Either way, step success rate is worth instrumenting first, because run-level failure is driven by per-step failure whatever the dependence structure.
The signal that matters most here is also the hardest to compute, because correlating early-step anomalies with final quality needs a quality label on the output, and you may not have one. Where you capture human feedback, use it as the label. Where you do not, output schema compliance is a cheaper proxy, and it catches the malformed cases while missing the plausible-but-wrong ones. Instrument step success rate first either way, since it needs no label at all. Be clear about what it buys you: it catches the steps that fail loudly and is blind to the ones that returned something plausible.
Failure mode 4: Hallucinated function arguments
A model generating function call arguments can produce values that are syntactically valid but semantically wrong: a date string in the right format but the wrong date, a user ID that looks plausible but doesn't exist. These pass schema validation and then cause incorrect downstream actions. Validating against business-logic constraints is the fix, and it is expensive because someone writes and maintains those constraints by hand. Blast radius is the line worth drawing. Arguments that touch write paths earn the constraints; read-only calls stay on schema validation.
Failure mode 5: Infinite loops and runaway agents
Agents without well-defined convergence conditions can re-invoke themselves indefinitely, particularly in ReAct-style architectures (reasoning and acting, where the model chooses its own next action). Baseline step count per run first. A hard step ceiling is simple and safe for an agent with a bounded task. For an open-ended research agent, the same ceiling produces false kills, so budget on cumulative run-level cost and let step count float. It catches the loop after the spend, not before.
Why traditional ML monitoring falls short for agents
The agent orchestration layer, meaning step sequencing, tool calls, context state, and run-level cost, sits above the model layer and below the application layer. Tooling for it is young, and the stack you are running now was probably assembled before the layer existed. Cost is the clearest case. Per-call pricing exists everywhere, and run-level attribution does not, so a run that burned forty dollars across nine steps arrives as nine separate line items. Cloud data cost optimization addresses that gap.
You can't close the gap by adding dashboards to an existing stack, because the data model differs. Traditional ML monitoring thinks in requests and responses. Agents produce runs, steps, and tool calls, which need different instrumentation, storage, and query patterns. A request-and-response schema has nowhere to put "step seven of eleven called the pricing API with a malformed date, and the framework retried twice before returning null." That line is what the support screenshot resolves to.
The shape we want already has a name outside AI. OpenTelemetry defines a trace as the path of a request through an application, built from spans that nest in parent and child relationships. An agent run maps onto that model cleanly: the run is the trace, each step is a span, and each tool call is a child span. If your platform already emits traces, the storage problem is largely solved, and the remaining work is instrumenting the agent loop itself.
What agentic data observability actually requires
Agentic data observability is the practice of instrumenting agent runs at every level where they can fail. It extends data observability upward, out of pipelines and tables and into the orchestration layer where agents operate. That means instrumentation at five levels:
- Run level: End-to-end latency, run-level cost, success or failure, step count.
- Step level: Step success rate, per-step latency, input and output token count, error type, tool invoked.
- Tool call level: Call success rate, argument validity, external dependency health.
- Context level: Token accumulation rate, context window utilization, pruning events.
- Output level: Schema compliance, output quality drift, hallucination rate.
Two of the five are worth having before the others. Step success rate needs no quality label, and it turns a bad run into a bad step, so step level comes first. Tool call level comes second, because that is where a failed step gets a cause you can act on. Run level is cheap once you have both. Context and output level cost more. One depends on framework internals you may not control. The other needs a label you may not have.
Why retrofitting costs more
Instrument before you scale. Instrumentation is cheap while the architecture is still being written and expensive to retrofit, because retrofitting means touching call sites a codebase has since grown around. Emitting traces already reduces that cost, but it does not remove it.
From signals to production reliability
Collecting signals is the easy half. Agents move faster than anyone reads a dashboard. A signal that needs a person to notice it is already too late.
Calibrate per agent, not per fleet. A step count of 12 is routine for one agent and a runaway for another, and one threshold across a fleet buys false alarms and missed incidents at the same time. That costs lead time. Every new agent needs a baseline before its alerts mean anything. Budget about a week of running it unalerted.
The harder constraint is on the trace itself, because it has to survive the incident. Sampling that keeps a uniform slice will throw away the run you need, so decide at the tail: sample on outcome and keep every failed run whole. Tail sampling costs memory: you cannot know the outcome until the run ends, so you buffer every run's spans and discard on success, and a run that hangs is a buffer that never closes. Agentic data observability covers what that loop looks like running continuously.
What this doesn't do: none of it tells you whether the agent should have been given the task in the first place. Observability answers what ran, what it cost, and where it broke. In a regulated setting, it also supplies what you show, because "the agent decided to" is not an answer unless you can produce the trace.
How to evaluate an agentic data observability platform
Five questions separate platforms built for agents from those retrofitted for them:
- Can you show me a full trace of a ten-step agent run, with tool call detail at each step?
- Does your cost attribution work at the run level, or only at the model-call level?
- How do you detect a filling context window before output quality degrades?
- What happens when an external tool dependency goes down, and how does that surface?
- Does your platform cover multiple model providers (OpenAI, Anthropic, Google, open-source) inside a single agent run?
Question two is the one a demo can fake, because per-call cost summed in a dashboard looks identical to run-level attribution until you ask which run. Ask for a trace of a failed run, not a successful one. A platform that shows a clean ten-step trace and can't show you where a retry swallowed an error is instrumenting the wrong half.