Executive Summary
Cloud data platforms have become the operational backbone of modern digital enterprises. Yet for many organizations, cloud data spend has evolved faster than governance maturity. Enterprises are now managing increasingly complex combinations of Snowflake, Databricks, Amazon Redshift, BigQuery, Azure Fabric, Kubernetes, object storage, streaming infrastructure, and AI/ML workloads across multiple clouds, processes, and business units (BUs).
This complexity is creating a new mandate for FinOps leaders where they need to move beyond reactive cost optimization and toward continuous financial governance of data infrastructure.
Traditional cloud cost metrics such as “monthly spend” or “cost per account” are no longer sufficient for executive decision-making. Modern FinOps organizations require operational KPIs that connect infrastructure efficiency, business value, engineering accountability, and forecasting precision.
This report examines the seven most critical KPIs every FinOps lead should track for cloud data spend optimization. These metrics are designed for CIOs, CTOs, CFOs, Heads of Data Engineering, Cloud Platform Leaders, and FinOps practitioners managing enterprise-scale data ecosystems.
Why Traditional Cloud Cost Tracking Fails
Traditional enterprise data cloud economics relies heavily on indicators like:
- Total monthly spend
- Budget variance
- Cost center allocations.
While these traditional metrics provide a basic financial overview, they create a dangerous operational gap by failing to address strategic questions regarding workload business value, infrastructure waste, and data pipeline efficiency. Furthermore, they offer little insight into the predictability of data platform costs or how effectively AI workloads utilize infrastructure, leaving a blind spot between rapid engineering velocity and actual financial accountability.
To bridge this gap, modern cloud FinOps demands a transition toward proactive KPI frameworks that drive cross-functional accountability and real-time visibility across global tech hubs. A mature cloud data FinOps program requires advanced metrics that support unit economic benchmarking, predictive forecasting, and strict governance over high-compute AI and analytics workloads. By aligning cloud costs directly with tangible business value, the following seven core KPIs allow organizations to optimize their data infrastructure materially while maintaining high operational velocity.
KPI #01: Cost Per Query (CPQ)
Cost Per Query (CPQ) measures the average infrastructure cost required to execute a single analytical or operational query across cloud data systems.
CPQ = Total Queries ExecutedTotal Query Processing Cost
Why It Matters
For organizations running Snowflake, BigQuery, Databricks, or AWS Redshift, query inefficiency is one of the largest hidden cost drivers.
A rising CPQ typically indicates:
- Poor workload optimization
- Excessive data scans
- Inefficient joins
- Lack of partition pruning
- Idle warehouse overprovisioning
- AI-generated query explosions
- Inefficient concurrency scaling
CPQ is especially critical for organizations supporting:
- Self-service BI
- Embedded analytics
- Large-scale machine learning
- Generative AI applications
- Multi-tenant SaaS architectures
At enterprise scale, small increases in CPQ can translate into millions of dollars annually.
Organizations are increasingly integrating CPQ directly into engineering workflows and data product governance to stay ahead of the curve.
This transforms FinOps from cost management into an exercise centered around value engineering.
KPI #02: Data Storage Efficiency
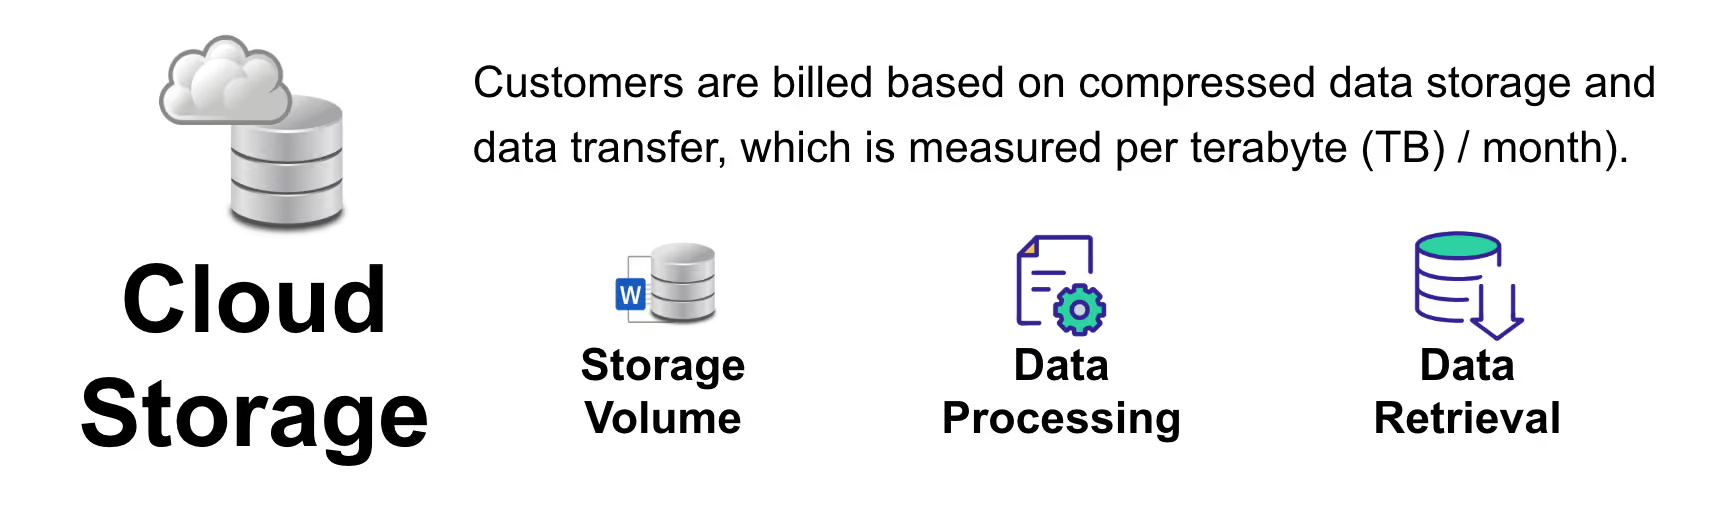
This KPI measures how effectively an organization manages storage expansion relative to business growth.
Data Storage Efficiency = Business Growth RateStorage Growth Rate
This is a key performance indicator (KPI) that shows how efficiently an organization manages its storage growth in relation to overall business growth. It helps businesses understand whether storage usage is increasing at a reasonable pace as operations expand. The metric is calculated by comparing the business growth rate to the storage growth rate.
A higher value indicates better efficiency, meaning the company is achieving business growth without excessive storage expansion. This KPI is valuable for improving cost control, resource planning, and long-term data management.
Why It Matters
Cloud object storage appears inexpensive initially but becomes materially expensive at enterprise scale due to:
- Replication
- Tiering failures
- Data retention mismanagement
- Backup duplication
- Orphaned datasets
- AI training data accumulation
AI adoption is accelerating storage expansion dramatically. Gartner attributes much of current public cloud growth to GenAI infrastructure requirements.

Organizations often underestimate secondary storage costs including:
- Metadata operations
- Retrieval charges
- Lifecycle transition failures
- Cross-region replication
- Compliance archiving
Leading organizations enhance storage efficiency by using modern data management practices and automation to better control data growth and reduce operational costs. Common strategies include automating data lifecycle processes, applying smart archival methods for inactive data, and using data observability tools to improve visibility into storage usage and performance.
These organizations also establish clear ownership of datasets to increase accountability and apply retention policies based on actual data usage and business value. Together, these practices support a more scalable, efficient, and well-managed storage environment.
KPI #03: Idle Compute Percentage
Idle Compute Percentage measures the amount of provisioned compute capacity that generates little or no business value.
Idle Compute Percentage = ( Unused Compute CostTotal Compute Spend ) x 100
Why It Matters
Compute costs remain the largest category of cloud waste. Common causes include:
- Zombie clusters
- Overprovisioned warehouses
- Forgotten development environments
- Low-utilization Kubernetes nodes
- Persistent GPU allocation
- Non-production environments running continuously
AI infrastructure worsens this challenge significantly because GPU clusters are exceptionally expensive and frequently underutilized.
Executive Benchmarks
Mature FinOps organizations generally target:
- Idle compute below 10%
- Automated rightsizing enforcement
- Dynamic autoscaling
- Aggressive off-hours shutdown policies
- Chargeback accountability models
KPI #04: Forecast Accuracy Rate
Forecast Accuracy Rate is an important cloud cost management metric that measures how closely projected cloud expenses align with actual cloud spending over a defined period. This KPI helps organizations evaluate the effectiveness of their cloud budgeting, financial forecasting, and resource planning strategies. A high forecast accuracy rate reflects strong financial control, optimized cloud resource utilization, and predictable operational costs.
In contrast, lower accuracy may indicate inefficient cloud usage, unexpected spending patterns, or gaps in cost optimization processes. Monitoring this metric enables businesses to improve cloud financial management, enhance budget planning, and support data-driven decision-making.
Why It Matters
Forecasting maturity is now a board-level concern. CFOs increasingly demand predictable cloud economics as cloud becomes one of the largest operational expenditures.
Poor forecasting creates:
- Budget overruns
- Delayed investment approvals
- Reduced investor confidence
- Financial planning instability
- Procurement inefficiencies
Cloud cost forecasting is increasingly complex due to the dynamic nature of modern cloud environments and evolving business demands. Elastic cloud consumption allows resources to automatically scale based on workload requirements, making spending patterns difficult to predict accurately. Rapid growth in AI experimentation and machine learning workloads can also lead to sudden spikes in cloud resource usage and operational costs. In addition, dynamic scaling, changing engineering priorities, and unpredictable development activities create further uncertainty in cloud budget planning.
Organizations operating in multi-cloud environments must also navigate different pricing models, service structures, and billing systems across cloud providers. Reserved capacity commitments add another layer of complexity by introducing long-term financial obligations that can impact overall cloud cost optimization and forecasting accuracy.
KPI #05: Data Pipeline Cost Efficiency
This KPI measures the operational cost required to process and deliver usable data through enterprise pipelines.
Data Pipeline Cost Efficiency = Useful Data ProcessedPipeline Operating Cost
Why It Matters
Modern enterprises run thousands of data pipelines daily across batch systems, streaming infrastructure, ETL platforms, AI feature pipelines, and CI/CD architectures. Hence, pipeline inefficiency often results from:
- Redundant transformations
- Poor orchestration
- Overprocessing
- Excessive retries
- Data duplication
- Unoptimized scheduling
Organizations are increasingly adopting advanced cloud cost benchmarking metrics to improve platform performance, operational efficiency, and infrastructure governance. Key benchmarks include cost per terabyte (TB) processed, cost per pipeline execution, streaming efficiency ratios, AI feature generation costs, and ETL compute intensity. These cloud performance metrics help businesses evaluate the efficiency of data processing workflows, optimize cloud resource utilization, and control infrastructure spending.
As modern data platforms and AI-driven workloads continue to grow, this KPI is becoming a critical foundation for platform engineering governance, enabling organizations to support scalable operations, improve cloud cost optimization, and drive more informed technology and financial decisions.
KPI #06: Cost Allocation Coverage
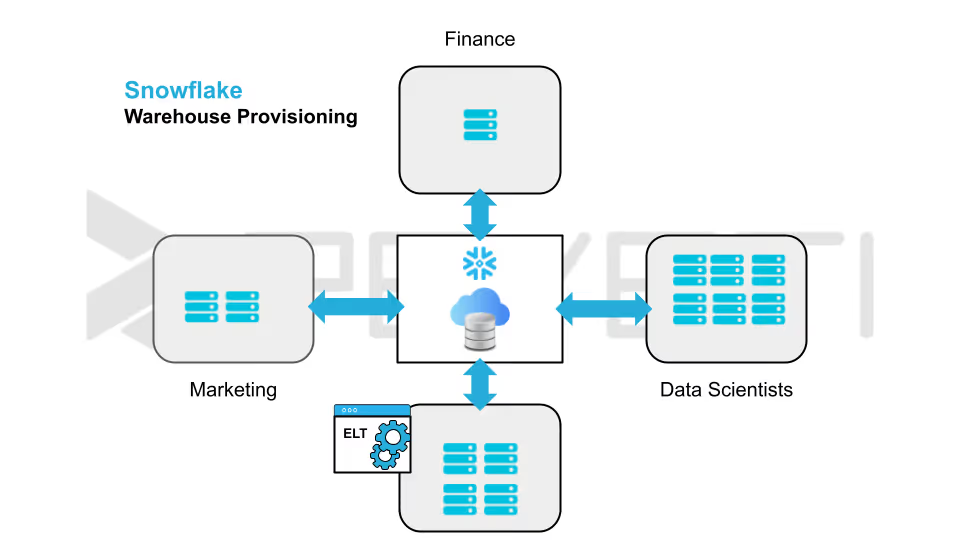
Cost Allocation Coverage measures how much cloud spend can be accurately attributed to a team, product, customer, or business unit.
Why It Matters
Without accurate cloud cost attribution, organizations face significant challenges in maintaining financial accountability and operational transparency. Low cost allocation coverage can create budget ambiguity, making it difficult for departments and teams to track and manage cloud spending effectively.
This lack of visibility often leads to shadow consumption, where unmonitored resource usage increases overall infrastructure costs. In addition, unclear ownership of cloud expenses can cause internal disputes, reduce support for cost optimization initiatives, and limit executive visibility into business-critical spending patterns.
Implementing strong cloud cost allocation and governance practices is essential for improving financial control, resource accountability, and data-driven decision-making across modern cloud environments.
High-maturity FinOps organizations target:
- 90% allocation coverage
- Mandatory tagging enforcement
- Real-time lineage tracking
- Shared-service cost apportionment
- Customer-level unit economics
KPI #07: Cloud Unit Economics
Cloud Unit Economics is a critical cloud cost management framework that measures the relationship between cloud spending and the business value generated from technology investments. Organizations commonly track metrics such as cloud cost per customer, cloud cost per transaction, cloud cost per AI inference, cloud cost per revenue dollar, cloud cost per dashboard user, and cloud cost per terabyte (TB) analyzed.
These cloud financial metrics help businesses evaluate operational efficiency, optimize cloud infrastructure costs, and align technology spending with measurable business outcomes.
As cloud adoption, AI workloads, and data-driven operations continue to expand, Cloud Unit Economics has become one of the most important KPI categories for executive leadership, finance teams, and platform engineering organizations. Boards, CFOs, and technology leaders increasingly expect businesses to demonstrate economic scalability, margin efficiency, sustainable AI adoption, and stronger operational leverage.
By connecting cloud operations directly to enterprise performance and profitability, Cloud Unit Economics enables organizations to improve cloud cost optimization, support strategic decision-making, and build more scalable and financially sustainable digital infrastructure.
The Evolution of FinOps KPIs: How AI Changes Everything
AI workloads are fundamentally reshaping cloud economics by introducing highly resource-intensive computing requirements and unpredictable consumption patterns. Modern AI and machine learning applications rely heavily on GPU-intensive processing, which significantly increases cloud infrastructure costs compared to traditional workloads. In addition, AI systems often generate bursty inference demand, where cloud resource usage can rapidly fluctuate based on user activity, real-time analytics, and application scaling needs.
Complex IT ecosystems also contribute to massive data storage expansion, as organizations must manage large training datasets, machine learning models, vector databases, and generated outputs. Continuous experimentation, model training, fine-tuning, and testing further increase operational overhead and cloud spending complexity.
As AI adoption accelerates across industries, cloud unit economics has become a critical component of AI governance, enabling organizations to measure cost efficiency, optimize cloud resource utilization, support sustainable AI scalability, and improve financial accountability for AI infrastructure investments.
Organizations are increasingly consolidating FinOps and software asset management practices to achieve broader portfolio-level cost governance. However, enterprises in 2025 are reporting only a 43% visibility into their complete IT estates, down from 47% the previous year.

FinOps leaders who fail to modernize KPI frameworks risk losing strategic influence within the enterprise.
Recommendations for FinOps Leaders
1. Treat FinOps as a Strategic Function
FinOps should report into strategic operational leadership, and not just merely about infrastructure operations.
2. Build a Unified Data + Financial Governance Layer
Separate engineering and finance workflows create fragmented accountability. Unified governance enables faster optimization, improved investment planning, and end-to-end AI cost control.
3. Invest in Real-Time Visibility
Monthly reporting cycles are obsolete for cloud economics. Modern enterprises require real-time telemetry, augmented anomaly detection, automated cost optimization, and department-level accountability.
4. Align KPIs to Business Outcomes
Cloud metrics without business context create optimization theater.
Every KPI should connect directly to:
- Revenue
- Margin
- Customer growth
- Product performance
- AI ROI
Conclusion
Cloud data spend has become one of the most strategically important operational expenditures in modern enterprises. As organizations scale AI adoption, multi-cloud architectures, real-time analytics, and platform engineering initiatives, traditional cost governance approaches are no longer sufficient.
The next generation of FinOps leadership will be defined not by who cuts the most cost, but by who delivers the highest economic efficiency at scale!
The seven KPIs outlined provide the foundation for that transformation:
- Cost Per Query
- Data Storage Growth Efficiency
- Idle Compute Percentage
- Forecast Accuracy Rate
- Data Pipeline Cost Efficiency
- Cost Allocation Coverage
- Cloud Unit Economics
Together, these metrics enable organizations to move from reactive cloud cost management toward predictive, value-centric operational governance.
For C-suite leaders, the message is clear: cloud economics is now a competitive differentiator. Organizations that operationalize FinOps maturity will outperform peers in agility, scalability, AI readiness, and profitability.