Databricks is an unified, analytics data platform, empowering organizations to process massive datasets, run advanced analytics, and build AI/ML models with unparalleled speed and collaboration.
Founded in 2013 by the creators of Apache Spark, Databricks has revolutionized modern data architecture. By merging the massive scalability of a data lake with the high-performance reliability of a data warehouse, it created the Lakehouse (which is a hybrid environment designed for the AI-driven era).
How Databricks Operates
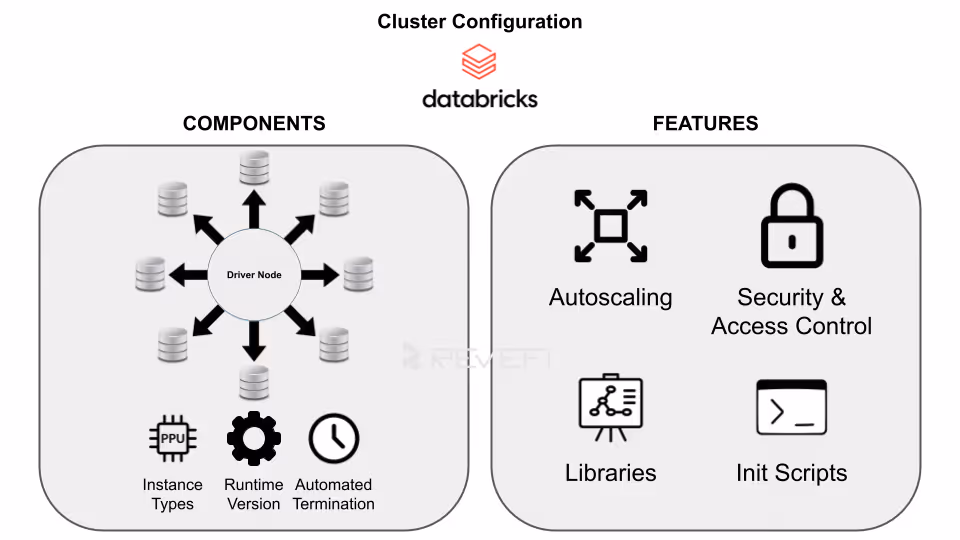
Databricks abstracts away the headaches of infrastructure management. You simply define the workload and configure the cluster; the platform handles the orchestration, auto-scaling, and fault tolerance.
The architecture is split into four primary components:
1. The Control Plane
Managed entirely by Databricks, this layer hosts the web UI, job scheduler, and cluster management APIs. Because Databricks handles the backend, users don't manage or pay for this layer directly.
2. The Data Plane
This resides within your specific cloud account (AWS, Azure, or GCP). Your virtual machines (VMs) and storage buckets live here. When a job is triggered, Apache Spark clusters spin up to process data and automatically shut down upon completion to save costs.
3. The Lakehouse (Powered by Delta Lake)
Data is stored in open formats (Parquet with Delta logs) inside your cloud object storage. This ensures data sovereignty (where you own your data in a non-proprietary format), while Databricks provides the high-performance compute layer on top.
4. DBU-Based Pricing Model
Databricks utilizes a consumption-based model measured in Databricks Units (DBUs).
- Interactive/All-Purpose Clusters:
Typically priced between $0.40–$0.55 per DBU, these are used for manual analysis.
Automated Job Clusters: Optimized for scheduled production workloads, these are more cost-effective at approximately $0.15 per DBU.
What Can You Use Databricks For?
Databricks serves as the backbone for a wide range of data workloads:
Its versatility is its greatest strength and also the most common driver of runaway costs. Its pay-as-you-go model (powered by elastic compute resources, promises seamless scalability) spin up clusters instantly to handle spikes in demand, then scale down when workloads lighten.
This elasticity drives innovation and agility, allowing teams to experiment freely without heavy upfront infrastructure investments. However, this same flexibility often becomes a double-edged sword.
Common culprits include idle clusters left running after jobs complete, oversized all-purpose clusters for simple tasks, inefficient Spark code causing excessive shuffles or spills, unoptimized Delta tables with small-file problems, and over-provisioned resources that sit partially utilized.
Without proper governance, ad-hoc notebooks, forgotten interactive sessions, and poorly scheduled jobs compound the issue, turning elasticity into expensive waste.
Reducing Databricks costs doesn’t always mean sacrificing performance or limiting capabilities. Instead, it requires architectural rigor to implement seamlessly.
With structured governance, continuous monitoring, and smart architectural decisions, organizations transform the platform's elasticity from a cost driver into a true competitive advantage, thereby delivering high performance without the high price tag.
Why Do Databricks Costs Spike and How Can We Fix That?
Runaway Databricks costs often stem from a few common inefficiencies that quietly drain budgets over time.
One of the biggest culprits is idle compute resources, which are basically clusters left running without active workloads (like keeping lights on in an empty office). This unnecessary usage can significantly inflate cloud spending if not monitored closely. Additionally, overprovisioning plays a major role in escalating costs. Many teams opt for high-performance instances by default, resulting in paying for unused computing power that doesn’t align with their actual workload requirements.
Another key factor behind rising Databricks expenses is inefficient configuration. Relying on default settings may seem convenient, but it rarely delivers cost-efficient performance. Optimizing cluster configurations, right-sizing resources, and aligning infrastructure with workload demands are essential steps for effective Databricks cost management.
Managing Costs Across Your Databricks Ecosystem in 2026
To keep your Databricks environment sustainable in 2026, you need to bridge the gap between innovation, velocity and disciplined spending. The first step in any cost optimization journey is gaining complete visibility into your Databricks usage. Without it, you're essentially navigating in the dark, unable to identify waste or inefficiencies.
After getting a clearer picture of your inflated Databricks costs on a micro-level, you can then begin to optimize costs based on the issue at hand.

DBU v/s Cloud Infrastructure Costs
To master Databricks cost reduction, organizations must first grasp its two-tiered pricing structure (which separates the total bill into distinct but interconnected components).
Databricks Unit (DBU) Costs
The first tier is where the software fee is paid directly to Databricks for the overall processing power consumed on its Lakehouse platform.
A Databricks Unit (DBU) measures compute capability, billed per-second based on factors like:
Workload type (e.g., Jobs Compute starting around $0.15/DBU, All-Purpose Interactive at $0.40–$0.55/DBU in Premium tier)
- Cluster configuration
- Edition (Standard, Premium, or Enterprise)
- Cloud provider (AWS, Azure, GCP)
- Region
DBUs capture the value of Databricks' optimized runtime, Photon acceleration, Delta Lake management, and governance features.
Cloud Infrastructure Costs
The second tier comprises the underlying:
- Virtual machines (e.g., EC2 on AWS, Azure VMs, or GCE instances)
- Storage (S3/ADLS/Cloud Storage)
- Networking
- Other cloud resources (billed separately by your provider)
These costs scale with instance type, size, runtime duration, and usage patterns (e.g., spot instances for savings or reserved capacity for predictability).
In non-serverless setups, infrastructure often rivals or exceeds DBU fees, as serverless compute bundles some infra costs into higher DBU rates for simplicity.
Details on Databricks pricing can be found here.
Unoptimized clusters or inefficient code can inflate both layers simultaneously.
Effective FinOps demands a "shift-left" approach, embedding cost awareness early in the development lifecycle.
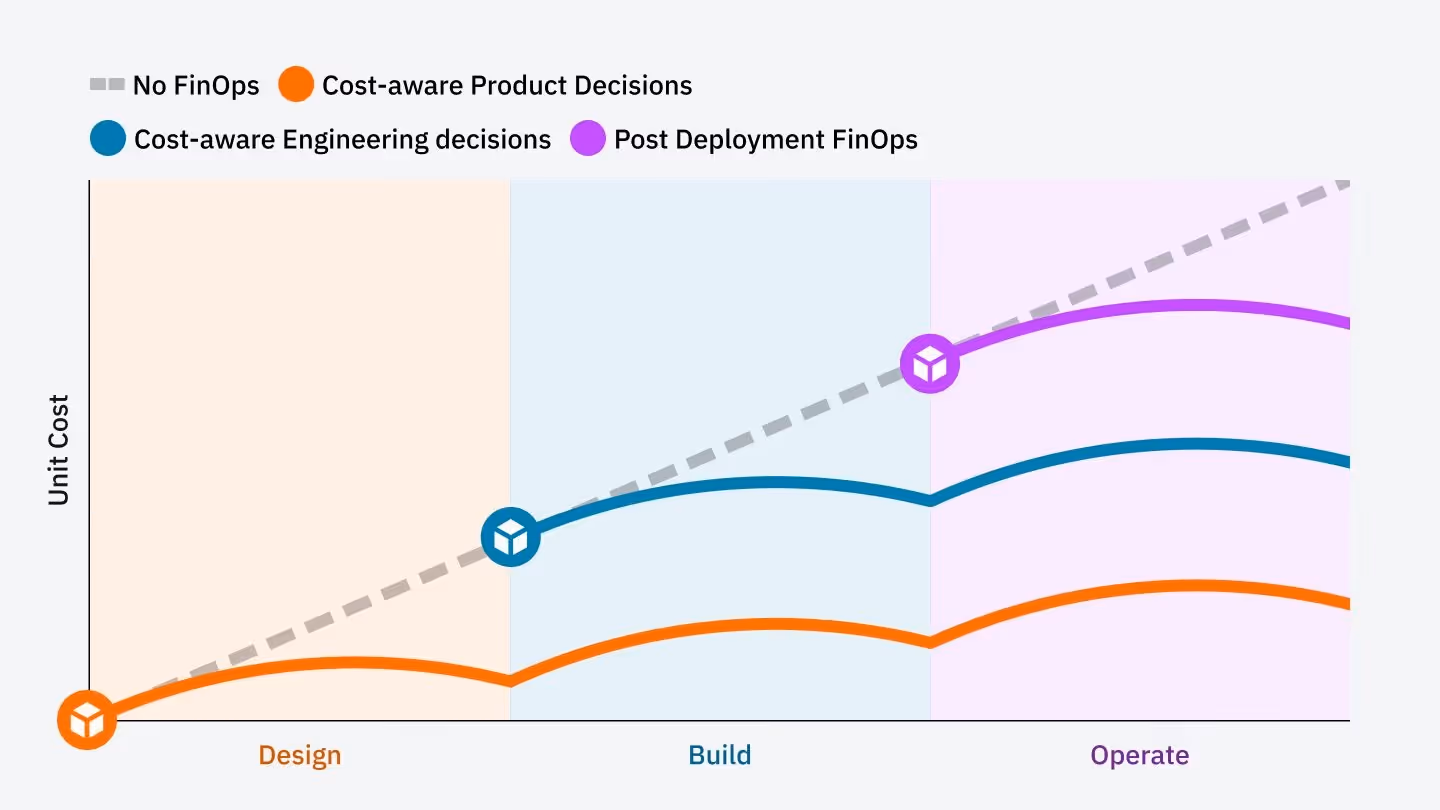
Engineers become accountable for the financial impact of their code and architecture decisions. This cultural shift empowers teams to design efficient pipelines that deliver value without runaway spend. By shifting left, organizations align innovation with fiscal discipline.
Compute Optimization v/s Selecting the Right Engine
The most common source of overspending in Databricks is selecting the wrong cluster type for the workload. Mismatches lead to:
- Unnecessary idle time
- Higher DBU rates
- Inflated infrastructure bills
Strategic choices between compute options can deliver dramatic savings without compromising performance.
Serverless vs. Classic Compute
Serverless SQL Warehouses represent the gold standard for Total Cost of Ownership (TCO) in BI, analytics, and ad-hoc SQL workloads. Unlike classic (pro or standard) warehouses, serverless eliminates cluster spin-up delays (starting instantly in seconds, rather than minutes).
Serverless also features intelligent workload management, where it auto-scales compute elastically based on demand and scales down (or suspends) immediately after queries are completed, ensuring customers are only paying for actual execution time. This contrasts with classic warehouses, which often require manual sizing, fixed configurations, and can incur costs even during low activity.
Job Clusters vs. All-Purpose Clusters
A major cost trap is using All-Purpose (Interactive) Clusters for production ETL/ELT pipelines. These clusters are designed for collaborative notebooks and development, carrying premium DBU rates because they stay running, and don't terminate automatically.
Job clusters, by contrast, are purpose-built for scheduled, automated workloads. They launch on demand, run the task, and shut down immediately upon completion, eliminating idle charges entirely.
By right-sizing compute workloads (serverless for queries, Job clusters for ETL), teams can cut overspend substantially while maintaining speed and scalability.
Cluster Policies
Cluster Policies (or Compute Policies) allow administrators to enforce standardized configurations across a workspace. Rather than granting users "blank check" access to create any resource, policies restrict choices to cost-efficient, pre-approved templates.
Key enforcement capabilities of cluster policies include:
- Instance Constraints:
Limiting users to cost-effective VM types (e.g., Graviton-based or Spot instances) and forbidding expensive GPU instances for standard ETL. - Sizing Limits:
Capping the maximum number of workers to prevent "runaway" autoscaling during a single inefficient query. - Mandatory Attributes:
Forcing the activation of auto-termination and requiring specific tags (like CostCenter or ProjectID) for downstream billing attribution.
In 2026, organizations use "T-shirt sizing" (Small, Medium, Large) policies to simplify the user experience while ensuring that infrastructure is right-sized for the specific workload complexity
Optimizing Storage and Data Management Costs
Storage costs are often overlooked, yet they profoundly influence overall Databricks expenses. While storage itself (e.g., S3, ADLS, GCS) is relatively cheap, the way data is written directly impacts the compute power required to read it.
Poorly managed tables (especially those with millions of tiny files) generate massive metadata overhead, forcing Spark executors to scan excessive Parquet files, inflate I/O operations, and prolong query execution times.
This extends cluster runtime, multiplying both DBU and infrastructure costs.
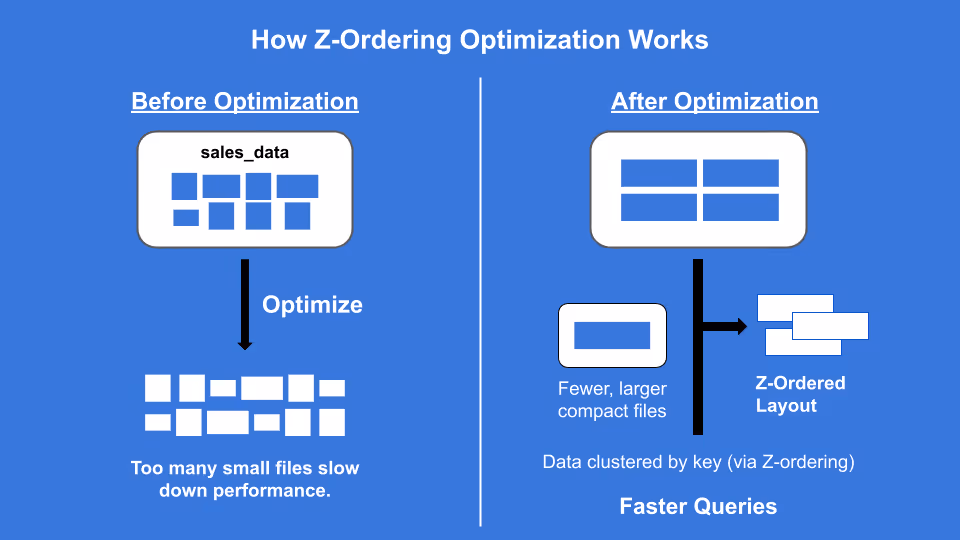
Data Skipping and Z-Ordering
Large tables with millions of small files create "Metadata Overhead”, forcing clusters to work harder.
- The Technical Fix:
Use the OPTIMIZE command with ZORDER. This collocates related information in the same set of files - The Result:
Drastically reduces I/O and speeds up queries, meaning your clusters run for shorter durations
Liquid Clustering
For massive datasets, replace manual partitioning with Liquid Clustering. It dynamically adjusts data layout based on clustering keys, preventing "partition skew" which often leads to "straggler tasks" that keep clusters running longer than necessary.
Advanced Auto-Scaling and Spot Instance Cost Optimization Strategies
Beyond cluster selection and data optimization, two powerful levers can further slash Databricks expenses: leveraging discounted cloud instances and activating the Photon engine for accelerated processing.
Leveraging Spot Instances
For non-production environments, development/testing, or fault-tolerant workloads (e.g., ETL jobs with retries, ML training that can checkpoint), Spot Instances (AWS) or Spot VMs (Azure) offer massive savings on the cloud infrastructure layer.
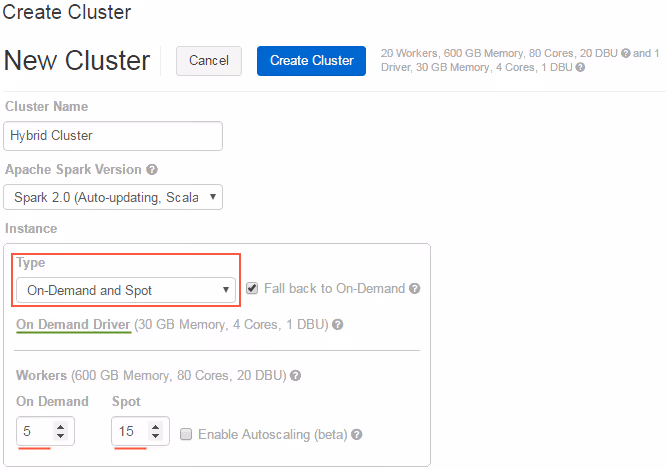
- Strategy:
Configure clusters with a reliable On-Demand primary driver node for stability (ensuring the Spark driver doesn't get evicted) while using Spot worker nodes for scalable, interruptible compute. In Databricks, enable the "On-Demand and Spot" instance type option with fallback to On-Demand if Spot capacity is unavailable. Databricks gracefully handles spot node decommissioning by reassigning tasks or restarting them, minimizing job failures.
- Risk Mitigation:
Databricks handles the decommissioning of spot nodes gracefully, but you need to ensure that your jobs are idempotent. This can drive-down the cloud infrastructure portion of your bill.
Photon Engine Optimization
Photon, Databricks' vectorized query engine written in C++, replaces parts of the traditional JVM-based Spark execution for dramatically faster performance. This is often more visible with complex queries involving joins, aggregations, filters, and scans.
While Photon has a higher DBU multiplier, the speedup frequently outweighs the premium.
These techniques, which are spot for infra discounts and Photon for runtime efficiency, unlock substantial TCO reductions when applied thoughtfully.
Building Custom Databricks Cost Dashboards
You cannot optimize what you do not measure. Traditional cloud billing consoles (AWS Cost Explorer or Azure Cost Management) often provide a delayed and aggregated view of Databricks spend. To achieve real-time granularity, you must leverage Databricks System Tables.
Enabling the Billing System Schema
The foundation of Databricks observability is the system.billing.usage table. This table tracks every DBU consumed, mapped to the specific workspace, cluster, and user.
To start, ensure your Unity Catalog is enabled and system tables schemas are active. You can then run the following SQL to identify your "top spenders":
SELECT
  usage_metadata.cluster_id,
  sum(usage_quantity) as total_dbus,
  (sum(usage_quantity) * <your_contract_rate>) as estimated_cost
FROM
  system.billing.usage
WHERE
  usage_date > current_date() - interval '30 days'
GROUP BY 1
ORDER BY 3 DESC
LIMIT 10;
Analyzing Warehouse Efficiency (Serverless vs. Pro)
If you are using SQL Warehouses, you need to monitor the "Scaling Factor." A warehouse that stays at its maximum scaling limit for long periods suggests either a lack of concurrency or poorly optimized queries.
- Scaling Peak: If max_clusters are always hit, you definitely have a performance bottleneck issue.
- Idle Burn: Check the system.billing.usage for "Startup" costs versus "Active" processing.
Mapping DBUs to Business Value
The most advanced FinOps teams use Tagging Strategies to calculate Unit Economics. For example, calculating the "Cost per ETL Pipeline Run" or "Cost per Monthly Active User (MAU)."
Advanced Data Engineering Patterns for Cost Reduction
Beyond infrastructure, the way you write your Spark code significantly impacts the bottom line. Optimizing data engineering costs requires shifting focus from cloud infrastructure to the architectural efficiency of the code itself.
When Spark jobs are poorly tuned, they run slower, and burn through compute credits, and exhaust storage budgets at an accelerated rate.
Mastering Shuffle Partition Tuning
One of the most common "hidden" costs in Spark is the default spark.sql.shuffle.partitions setting of 200. This static value is rarely appropriate. For small datasets, it creates hundreds of tiny tasks, where the scheduling overhead actually exceeds the processing time. Conversely, for multi-terabyte jobs, 200 partitions lead to massive data chunks that exceed executor memory, triggering a "Spill to Disk."
This forces Spark to write temporary data to slower local storage, dragging out job duration and increasing DBU (Databricks Unit) consumption.
The modern solution is Adaptive Query Execution (AQE). By enabling spark.sql.adaptive.enabled, Spark examines table statistics at runtime.
It can dynamically coalesce small partitions or split skewed ones, ensuring each task is right-sized for the available compute functions. This reduces unnecessary task orchestration and prevents expensive disk spills.
Strategic Storage Tiering and Delta Maintenance
Storage costs in a Data Lakehouse can snowball if left unmanaged. While Delta Lake provides "Time Travel" through versioning, every update or delete leaves behind physical files.
If you don't manage these, you are paying to store "ghost" data.
The VACUUM command is your primary tool for cost recovery. By running VACUUM table_name RETAIN 168 HOURS, you prune files older than seven days, significantly lowering your S3 or ADLS footprint.
For maximum efficiency, combine this with Storage Tiering, moving older, rarely accessed partitions to "Cold" or "Archive" tiers where the cost per GB is a fraction of standard storage.
AI Agents Bridge The Gap Between Cost Optimization and Automation
AI Agents are now available to transform Databricks cost management from a reactive manual process into a proactive, automated discipline.
Beyond infrastructure choices, how you architect your Spark code and manage your Delta Lake dictates your cloud ROI.
Unlike traditional monitoring tools that simply alert users to overspending, AI Agents utilize real-time telemetry to intervene directly in the data lifecycle.
While a standard dashboard might send a delayed email after a budget threshold is breached, an AI Agent analyzes active DBU (Databricks Unit) burn rates and compute patterns to identify inefficiencies in real-time.
These intelligent systems can dynamically adjust cluster configurations, such as downscaling underutilized nodes or migrating non-critical workloads from On-Demand to Spot instances mid-stream.
By integrating with System Tables and Query History, AI Agents identify "zombie" queries (those trapped in infinite loops or inefficient Cartesian products) and terminate them before they exhaust monthly cloud budgets.
This proactive intervention transforms Databricks cost management, ensuring that enterprise cloud spend remains strictly aligned with actual computational value and mission-critical business priorities.
Conclusion: The Continuous Cost Optimization Loop
Databricks Cost Optimization is not a "one-and-done" project; it is a continuous, iterative cycle designed to maximize ROI. True cloud financial management requires a persistent commitment to the four pillars of optimization:
- Tagging (Attribution): Implementing granular metadata to ensure every dollar spent is mapped to a specific department or project.
- Monitoring (Observability): Leveraging System Tables to gain deep insights into consumption patterns.
- Right-sizing: Utilizing high-performance features like Photon, Spot instances, and Serverless compute to match resources with workload demands.
- Refining: Constantly tuning Spark code and optimizing Delta Lake layouts to eliminate computational waste.
By adopting this proactive framework, organizations typically achieve anywhere between 25% to 50% reduction in total Databricks expenditures within the first 90 days.
Crucially, these savings are realized without compromising data throughput or developer velocity, ensuring your data engineering remains both lean and agile.