
.avif)
DataOps (Data Operations) is a collaborative data management methodology focused on improving the performance, integration, and automation of data flows between data managers and consumers across an organization. Think of it as the evolution of DevOps, but specifically tailored to meet the unique challenges of the data lifecycle.
While DevOps focuses on streamlining software development, DataOps aims to reduce the cycle time of building and operating data products while ensuring high data quality. It integrates Agile development, DevOps principles, and statistical process control to create a predictable environment for data engineering and data science.
In a time when businesses are powered by real-time insights, the traditional "siloed" approach to data results in bottlenecks and "data debt." DataOps solves this by:
- Reducing manual intervention in data ingestion and transformation
- Breaking down walls between data engineers, scientists, and business analysts
- Implementing continuous monitoring and testing to catch "dirty data" before it reaches the end-user
By treating data-as-code, organizations can deploy analytics with the same speed and reliability as modern software. This leads to faster time-to-value, improved scalability, and a robust data culture that empowers decision-makers with accurate, up-to-date information. For enterprises looking to scale their AI and ML initiatives, adopting a DataOps framework is a necessity
How Does DataOps Improve Data Pipeline Speed, Quality, and Observability at Scale?
DataOps is a specialized framework of practices, processes, and technologies that integrates engineering rigor into the delivery, monitoring, and maintenance of organizational data. The primary objective is to transform data pipelines into faster, more resilient, and easily governed assets while drastically reducing the manual labor often associated with data management.
52% of organizations have already implemented DataOps tools, and the category grew 21% in 2024 to reach $424 million in market revenue.
Why Has DataOps Become a Strategic Priority?
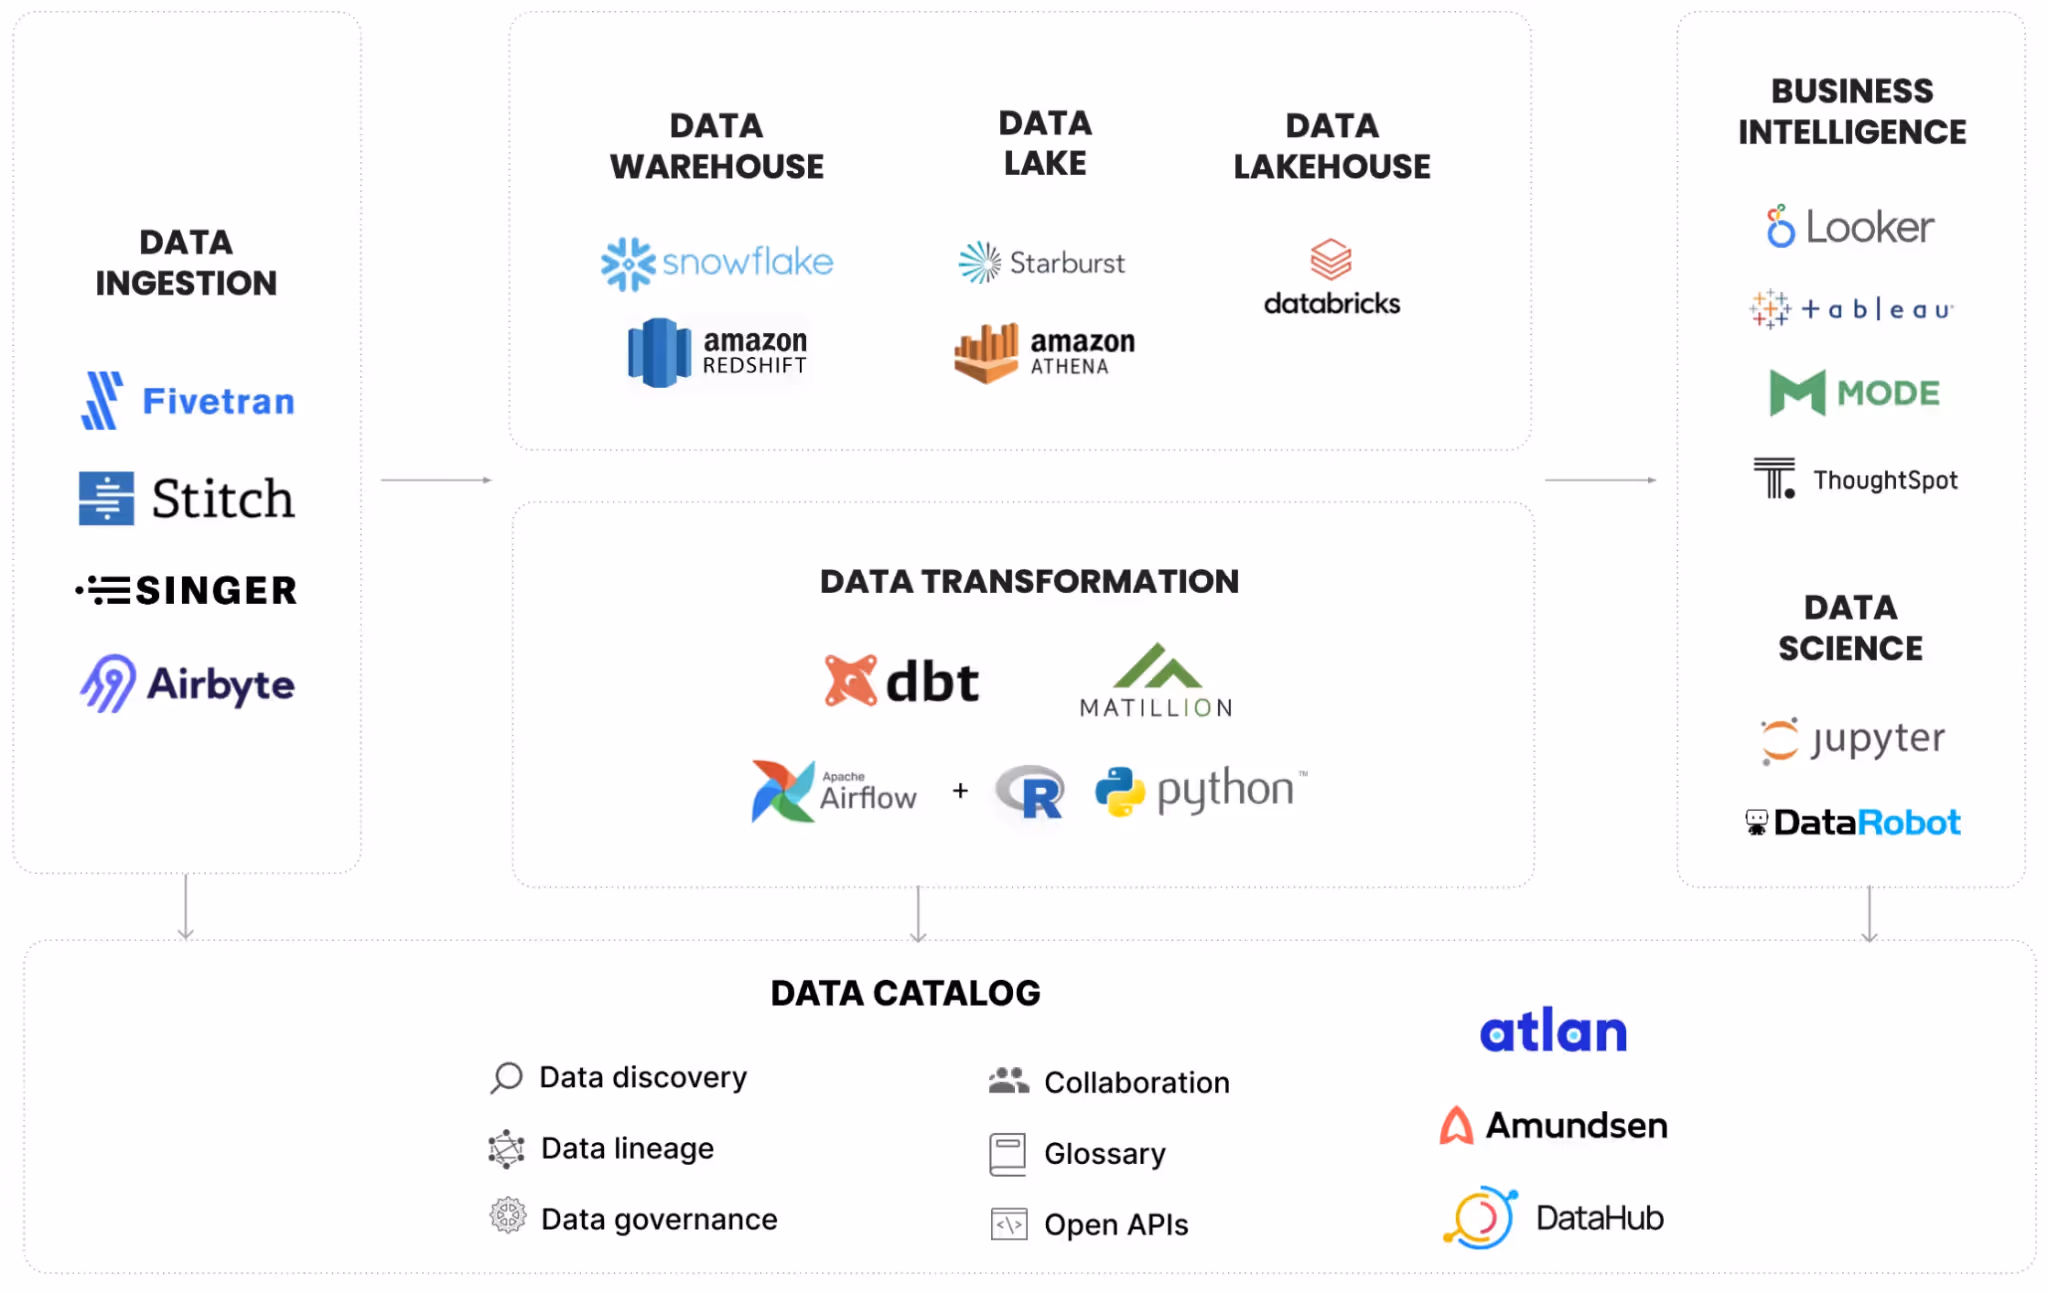
The modern data landscape has evolved into a complex ecosystem that can no longer be sustained through manual oversight. For Global 5000 organizations in 2026, the enterprise data stack typically involves a fragmented mix of multiple cloud data warehouses, diverse ingestion tools, and intricate transformation frameworks.
This infrastructure serves a growing list of stakeholders, all the way from human decision-makers to autonomous AI agents. Without a disciplined approach, small upstream changes can trigger catastrophic downstream failures, leading to "data downtime" that paralyzes business operations.
DataOps has emerged as a strategic priority because it addresses the core challenges of modern information management, which are:
- Mitigating High Operational Risks:
In unmanaged environments, a single schema update or misconfigured job can silently corrupt production datasets. DataOps introduces automation and observability to detect and resolve these issues before they impact the bottom line. - Reducing the Financial Impact of Poor Data Quality:
Inaccurate data carries a massive price tag. According to industry research, poor data quality costs the average enterprise approximately $12.9 million annually. Large-scale organizations often report losses exceeding $25 million when accounting for delayed decision-making and the high cost of engineering "firefighting." - Enabling AI Readiness:
The demand for "AI-ready" data has never been higher as Gartner analysts have projected that global AI spending is expected to surpass $2 trillion by 2026. Currently, 60% of AI initiatives are at risk of failure because the underlying data lacks the necessary freshness and accuracy. - Restoring Stakeholder Trust:
Only about a quarter of Chief Data Officers (CDOs) feel confident that their current data infrastructure can support revenue-generating AI. DataOps provides the governance and consistency required to turn data into a reliable corporate asset.
By implementing a robust DataOps strategy, companies can bridge the gap between raw data potential and actual business value, ensuring that the information feeding their most expensive AI investments is accurate, governed, and delivered in real-time.
For a more detailed deep-dive, you can check out our other blog that explores how modern enterprises run, and manage efficient data platforms.
The Core Pillars of an Enterprise DataOps Strategy
An effective enterprise DataOps strategy is a holistic ecosystem of interconnected capabilities designed to bring operational maturity to the entire data lifecycle.
By integrating eight (8) core pillars, organizations can transition from reactive troubleshooting to a proactive, automated, and scalable data culture.
1. Pipeline Orchestration and Automation
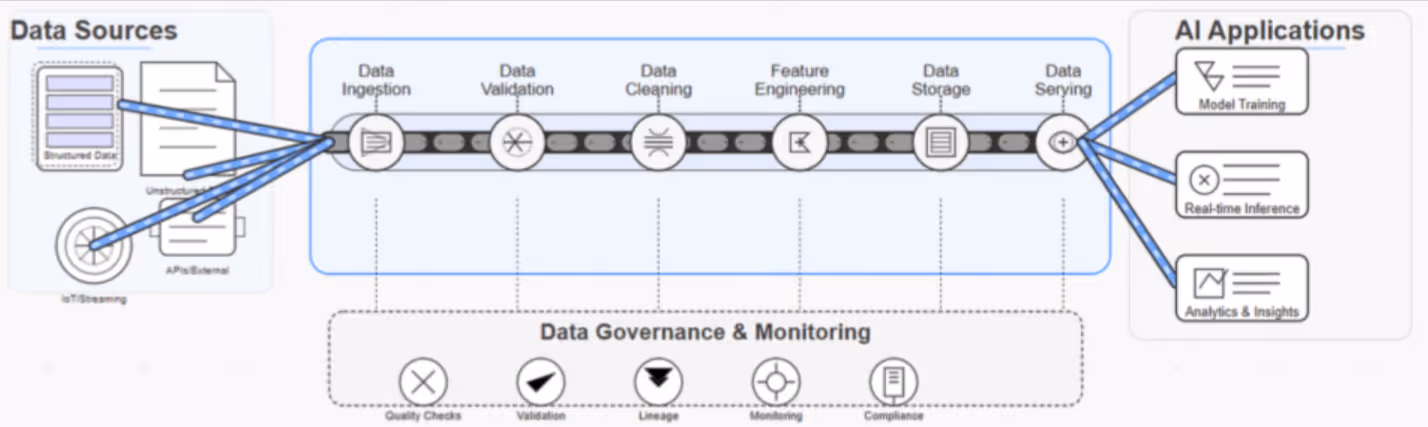
Orchestration serves as the foundational architecture of DataOps. It coordinates the end-to-end flow of information (from initial ingestion and complex modeling to final delivery) across diverse, hybrid-cloud environments.
A mature orchestration layer manages critical dependencies and conditional logic while providing automated retry handling, connector management, and comprehensive audit logging to ensure every workflow is traceable and resilient.
2. Data Observability
While monitoring tracks basic uptime, data observability focuses on the "health" of the data itself. This pillar ensures that data behaves as expected by continuously analyzing structures, volumes, freshness, and distribution patterns. By implementing real-time schema drift detection, null rate monitoring, and automated lineage tracing, teams can identify and resolve anomalies before they ever reach a downstream business analyst or AI model.
3. Continuous Performance Optimization
Often overlooked, performance optimization is a vital requirement for maintaining low latency and high efficiency. In modern cloud data warehouses, inefficient queries translate directly into ballooning costs and missed Service Level Agreements (SLAs).
DataOps teams utilize continuous visibility into query execution patterns and resource consumption to ensure that as data volumes scale, the infrastructure remains lean and responsive.
4. Integrated Data Quality Management
In a DataOps framework, quality is "shifted left," meaning checks are embedded throughout the pipeline rather than just at the point of consumption. This proactive approach includes:
- Automated Validation: Testing data against business rules and expected profiles.
- Regression Testing: Ensuring new pipeline changes don't break existing datasets.
- Anomaly Flagging: Automatically isolating data that deviates from historical patterns.
5. Data FinOps and Cost Governance
Cloud-native data platforms operate on variable cost models where compute charges can spiral out of control due to complex or redundant queries. Data FinOps is the practice of applying financial accountability to data infrastructure.
By enforcing cost governance and resource tagging, organizations can align their cloud spend with actual business value, preventing "sticker shock" from their infrastructure providers.
6. CI/CD for Data Pipelines
Applying Continuous Integration and Continuous Deployment (CI/CD) to data engineering ensures that pipeline definitions are version-controlled and treated like application code. This pillar enables automated testing before production promotion, structured approval workflows, and the ability to perform rapid rollbacks if an update causes an unexpected failure.
7. Automated Environment Management
Maintaining consistency between development, staging, and production environments is a major hurdle for data teams. DataOps solves this through Infrastructure-as-Code (IaC), allowing environments to be provisioned and decommissioned repeatably. This ensures that a pipeline passing a test in a staging environment will behave identically once it is deployed to production.
8. Operational Governance and Lineage
DataOps provides the technical backbone for modern data governance. Automated lineage tracking allows teams to trace the journey of a data point from its origin through every transformation to its final destination. This transparency is essential for performing impact analysis, resolving data discrepancies, and maintaining strict compliance with global regulatory standards like GDPR or CCPA.
The Role of DataOps in Achieving AI Readiness in 2026
The connection between DataOps and successful AI adoption has become an absolute necessity for the modern enterprise. As organizations scale their artificial intelligence initiatives, they face a hard truth: AI systems are only as effective as the data fueling them.
Ensuring that data across all enterprise levels is:
- Accurate
- Timely
- Well-governed
- Consistently available
Is fundamentally a DataOps challenge.
As capital investment in AI continues to accelerate through 2026, this infrastructure gap will only widen. Implementing a robust DataOps strategy is currently the most reliable pathway for leadership to bridge this divide and secure a return on their technology investments.
The evolution of Agentic AI is also transforming the internal mechanics of DataOps itself. We are seeing a shift toward autonomous systems capable of taking independent action based on real-time observations. These advanced tools are redefining efficiency through:
- Autonomous Anomaly Detection:
Identifying data irregularities the moment they occur. - Root Cause Analysis (RCA) & Diagnosis:
Automatically tracing errors back to the source to save hours of manual troubleshooting. - Self-Healing Pipelines:
Recommending and, in some instances, executing technical fixes without human intervention. - Operational Efficiency:
Platforms like Revefi are leading this charge, utilizing AI Agents to manage quality, performance, cloud spend, and usage autonomously.
By leveraging these AI-driven capabilities, data engineering teams can move away from "firefighting" and focus on high-value innovation. This shift not only reduces the operational burden on staff but also ensures that the data feeding your AI models meets the highest standards of integrity and performance.
What are the Common Enterprise DataOps Challenges?
While the theoretical framework of DataOps is easy to grasp, deploying it within a complex corporate landscape presents significant hurdles.
To achieve true operational maturity, leadership must navigate several common obstacles that frequently stall digital transformation.
Many organizations struggle with these recurring DataOps implementation challenges:
- Entrenched Organizational Silos:
Data engineering, platform ops, and BI teams often operate in isolation. These groups frequently use disparate tools and follow conflicting release cycles, making the cross-functional coordination required for DataOps difficult to achieve. - Excessive Tool Fragmentation:
Over time, enterprises often accumulate a "Frankenstein" stack of disconnected solutions for orchestration, observability, and cost management. This fragmentation leads to visibility gaps and high integration overhead, preventing a unified view of the data lifecycle. - Ambiguous Ownership of Data Reliability:
A major point of failure is the lack of a "single point of accountability" for data products. When a pipeline fails, responsibility often disappears into the cracks between the developers who built it, the IT teams managing the platform, and the end-users consuming the output. - Legacy Infrastructure Constraints:
Integrating modern automation into on-premises or hybrid environments is rarely seamless. Legacy systems often lack the APIs and flexibility found in cloud-native platforms, making it harder to implement consistent CI/CD and environment management. - Lack of Performance Metrics:
Without established Service Level Agreements (SLAs) for data uptime and quality, organizations cannot accurately measure their DataOps maturity. Establishing these baseline metrics is a critical first step to justifying further investment in the framework.
Successfully overcoming these barriers requires shifting from a tool-centric mindset to a process-centric culture. By centralizing ownership and standardizing the technology stack, enterprises can turn data from a liability into a high-velocity strategic asset.
Building a DataOps Capability Engine: Know Where to Start
Establishing a robust DataOps capability is a strategic journey rather than a one-time software installation. For enterprises looking to scale their data maturity in 2026, a phased implementation strategy consistently delivers better results than attempting a total organizational overhaul overnight.
By prioritizing visibility and incremental automation, teams can build a sustainable framework that scales alongside their data needs. Here is a roadmap for launching a successful DataOps practice:
- Establish Baseline Visibility:
Begin by mapping your existing data pipelines and identifying your most business-critical data products. Measuring current performance and reliability provides the essential benchmark needed to track future progress. - Prioritize High-Frequency Failures:
Focus your initial automation efforts on the "noisiest" processes. By automating the pipelines that require the most manual intervention or fail most frequently, you realize immediate operational gains. - Implement Instrumentation Early:
Data observability should be a prerequisite, not an afterthought. Integrating monitoring and alerting as pipelines are being built (rather than retrofitting them after a major outage) ensures proactive health management. - Define Clear Data SLAs:
Collaborate with business stakeholders to establish concrete Service Level Agreements. Define exactly what "high-quality data" means for your organization, including specific targets for latency, freshness windows, and acceptable error rates. - Shift Quality to the Left:
Integrate automated testing and validation directly into the delivery cycle. By making quality checks a mandatory part of the deployment process, you prevent corrupt or inaccurate data from ever reaching downstream consumers. - Operationalize Cost Governance:
Incorporate FinOps principles early in your DataOps journey. Building spend visibility into your daily operations prevents the "cloud bill shock" many organizations face when scaling their data platforms without oversight.
Taking these initial steps allows your team to demonstrate value quickly while building the technical foundation required for advanced AI and analytics.
DataOps in Practice: What Leading Enterprises Are Doing Differently
Mature organizations that have successfully scaled their DataOps capabilities exhibit distinct operational traits that set them apart in the global market. These leaders treat data reliability as a first-class product, backed by rigorous Service Level Agreements (SLAs) and unambiguous ownership.
By moving beyond reactive troubleshooting, they foster a culture where data is a trusted asset rather than a source of constant uncertainty. High-performing data teams typically demonstrate the following mature characteristics where:
- The vast majority of testing and deployment cycles are fully automated, minimizing human error and accelerating time-to-market for new insights.
- Instead of fragmented views, these organizations maintain a single, consistent window into the entire data stack, providing a "single source of truth" for pipeline health.
- Performance metrics and cloud expenditures are monitored continuously. Rather than waiting for monthly reviews, these teams use real-time dashboards to optimize spend and efficiency instantly.
- There is a strategic shift away from a "patchwork" of isolated point solutions. Mature enterprises prioritize integrated platforms that connect data quality, performance, lineage, and cost within a single analytical layer.
This move toward platform consolidation reflects a growing understanding that true operational visibility requires context. You cannot optimize performance without understanding cost, and you cannot guarantee quality without tracing lineage. By unifying these dimensions, mature DataOps organizations reduce complexity and empower their engineering teams to focus on innovation.
Conclusion
Organizations are taking up DataOps seriously because the alternative is having a fragile, expensive, and manually managed data environment with continuously growing cost.
The evidence is in the operational disruptions, the failed AI initiatives, and the cloud bills that don’t match the overall ROI delivered. With the same philosophy in mind, Revefi emerged as a fully-automated, and autonomous platform that connects data quality, performance optimization, cost management, and usage analytics without requiring separate tools or manual intervention.