Uncover Hidden Inefficiencies Across Databricks Jobs With Revefi’s AI Agent
Watch this video tutorial to learn how to analyze job runtime trends over the past 30 days to identify bottlenecks, and optimize performance.
What You’ll Discover
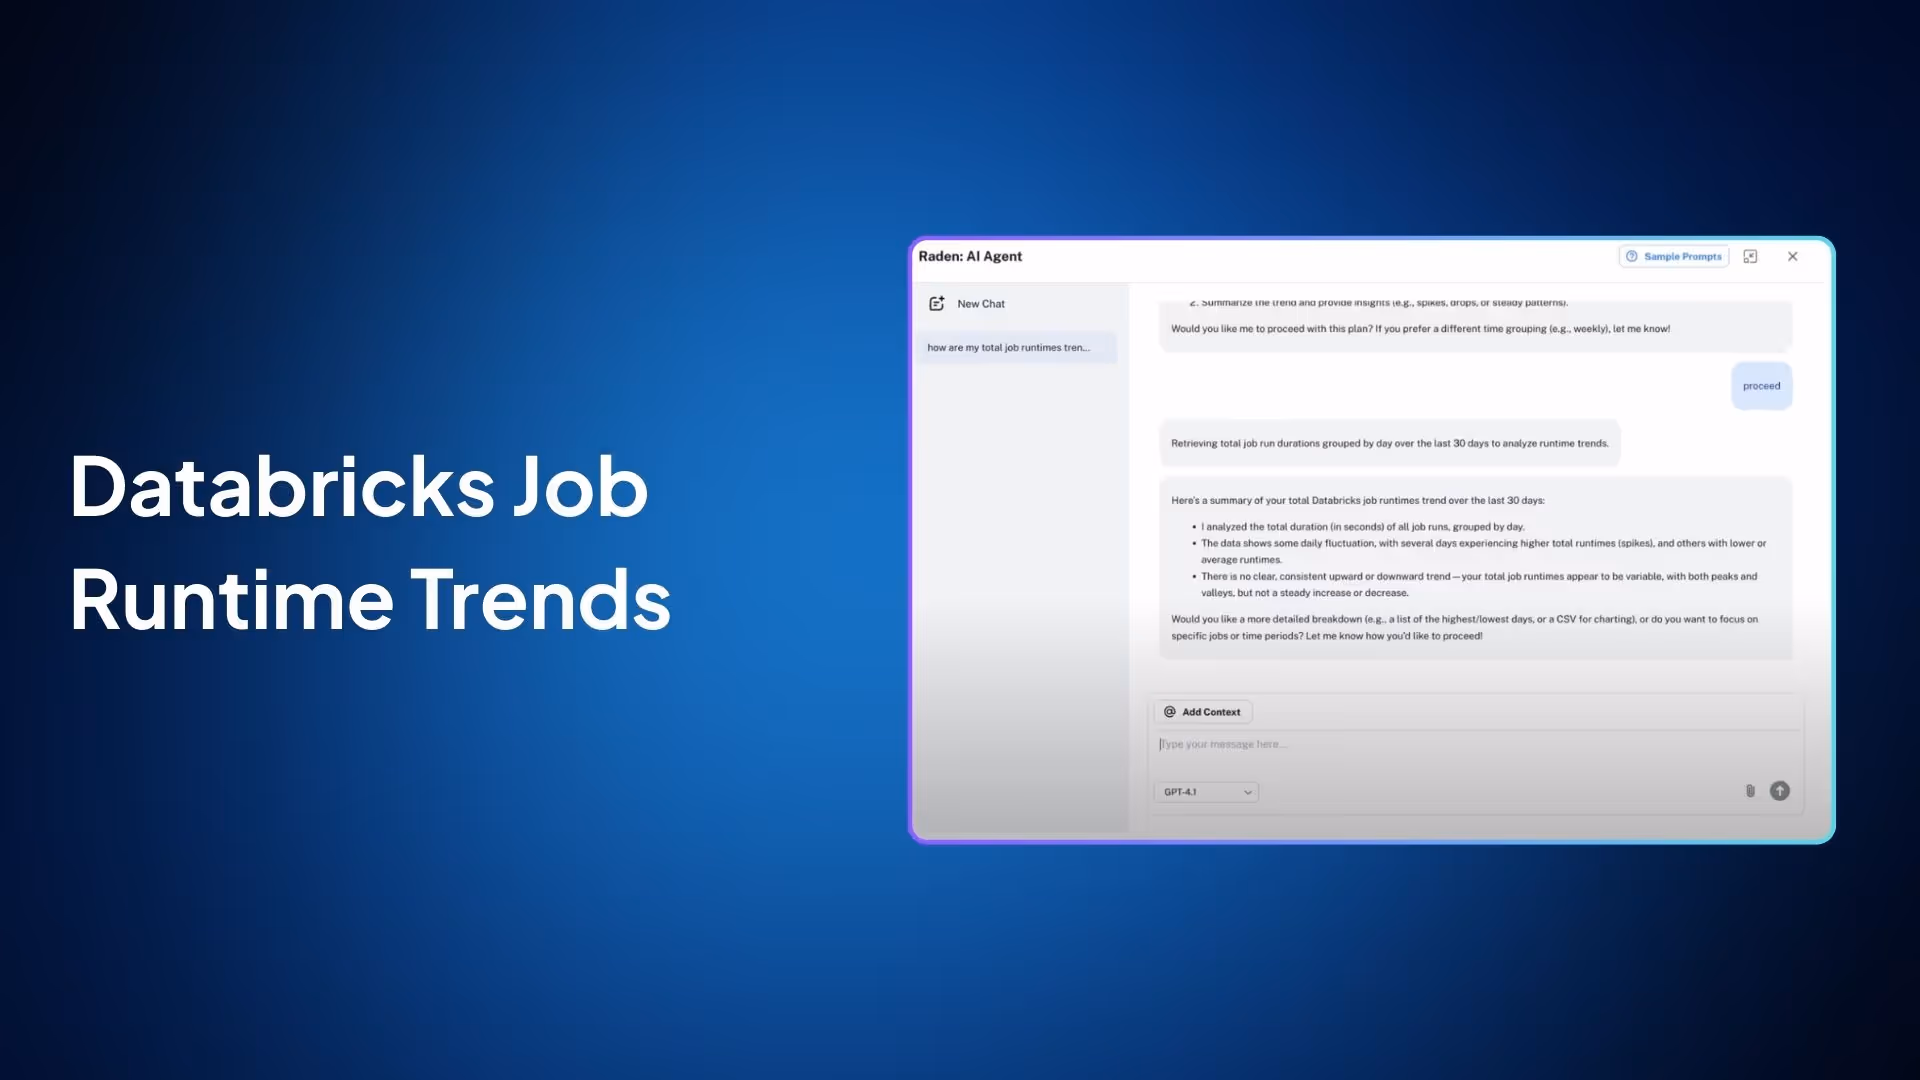
- See how Revefi’s AI agent reviews 30 days of job durations, highlighting fluctuations and identifying consistent upward or downward trends.
- Understand peaks and valleys in runtime, revealing variability in execution time rather than sustained growth.
- Breakdowns of highest and lowest runtime days, request detailed charting, or set up proactive monitoring to streamline your workflows.
Want to see our agentic AI solution in action?
Test out our solution in a secure, and fully compliant environment to get a real-time understanding of our product’s capabilities.