At Revefi, we empower users to better understand their data quality, cost, and performance from end to end. Our data operations cloud automatically alerts on both load and usage-related data anomalies, while providing insights into optimization and spend. To assess our product, we needed a test dataset that showcases Revefi’s capabilities, including deep lineage, compiled incident digests, external integrations, and RCA potential. We knew that the best way to demonstrate these features end-to-end was to build a realistic test dataset – one that effectively mocks real-world use cases.
TLDR: Outcomes & learnings from this project
Every company’s data infrastructure is unique and comes with its challenges. As data needs constantly fluctuate, so do data solutions - a process that we have witnessed firsthand as data engineers. Striving to meet the initial foundational requirements, this test dataset project led to many learning experiences. We explored many features that dbt offers, including jinja, macros, jobs, schedules, tests, sources, and documentation. We were able to step into the shoes of our users and better understand their thought processes from start to finish, creating a test dataset that has proved useful for several months.
However, the largest takeaway is that ultimately, our test dataset is not yet complete! As the product and specifically the ML & AI models we use at Revefi evolve, we continue to improve the dataset to keep pace.
What did we achieve?
- A flexible data model and pipeline that can scale to any number of tables using DBT
- Deep lineage which replicates customer environments
- Arbitrary injection of multiple types of failures at any stage in the data graph
- Ability to generate cascading failures in the data graph, where data quality issues in one table manifest as data quality issues in multiple downstream tables, even affecting the end user-facing BI dashboards
- Multiple scheduling granularities of DBT models from an hour to days, mimicking the scenarios in real data warehouses
What challenges did we face in creating this test dataset?
To replicate a customer environment, our test dataset required complexity and scalability. In particular, we needed enough tables to build a deep lineage graph that captures cascading failures. These failures could include low row count, high row count, no/late data load, and long execution times, all of which could impact downstream tables. Furthermore, these events had to occur consistently but at unpredictable intervals throughout the pipeline to be realistic. Because of this probabilistic factor and our previous experience with these tools, we chose Snowflake and dbt as our respective data warehouse and data orchestration solution. Leveraging these already-integrated platforms helped us create a test dataset that met our requirements.
Where did the data come from?
We decided to utilize the TPC-H dataset. TPC-H is a benchmark used to measure the performance of highly complex decision-support databases. This dataset contains eight production-grade intercorrelated tables (CUSTOMER, LINEITEM, ORDERS, PART, etc.). An added benefit is that several scale variations of the TPC-H dataset are readily available on Snowflake.

Building the dataset
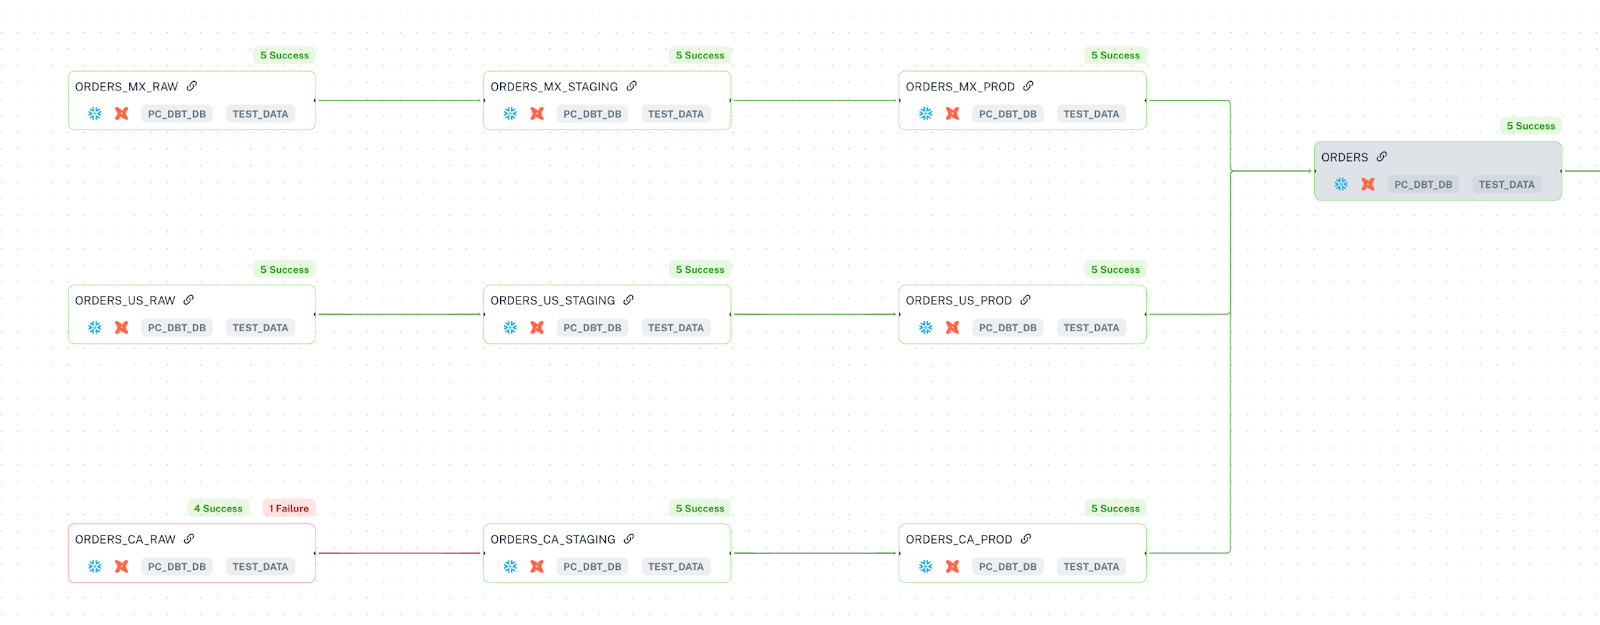
For our dataset, we took the original eight TPC-H tables and created closer to 100 tables with complex relationships. To accomplish this, we leveraged geo and time partitioning. Given a configurable number of partitions, we divided each table to represent different “countries”--in this case, the United States, Canada, and Mexico. Furthermore, to mimic real-world scenarios, we split our pipeline into three stages, raw, staging, and production. To simulate the ingestion of new data every day, we shifted the dates in the TPC-H dataset. An example lineage and model file for the ORDERS table are shown below.